2. Module 2
Module 2: Transcription, Part I: From DNA sequence to transcription unit
| Author: | Maria S. Santisteban (University of North Carolina - Pembroke) |
|---|---|
| Last Update: | Sep 02, 2019 |
| Version: | 0.0.1 |
2.1. Introduction
This module will introduce you to the use of the Genome Browser to illustrate the process of transcription and help you identify regulatory elements, using the Drosophila melanogaster transformer (tra) gene as an example. You will use the UCSC Genome Browser Mirror developed by the Genomics Education Partnership (GEP), which contains RNA expression data, to identify the different parts of the gene that give rise to pre-mRNA through transcription.
2.2. Investigation 1: Identify the Transcription Unit
Learning Objectives
- Use the genome browser to visualize a given transcriptional unit
- Predict the locations of exons and introns using RNA seq reads
2.2.1. Finding the transcript for tra-RA using the UCSC Genome Browser
- Open a new web browser window and go to the UCSC Genome Browser
Mirror site at http://gander.wustl.edu/. Follow the instructions
given in Module 1
to navigate to the
contig1project in the D. melanogaster “July 2014 (Gene)” assembly. - To navigate to the genomic region surrounding the tra gene, enter
contig1:9,650-11,000into the “enter position or search terms” field located just above the displayed tracks and then click on theGObutton.
Tip
As you learned in the previous module, you can also use the buttons in the navigation controls section to zoom in, zoom out, and use the arrows to move to different parts of the contig. In addition, you can place your cursor on the “Scale” or the “Base Position” sections of the Genome Browser image and then drag your cursor from the initial position to the end position to zoom into a region of interest.
- This region from 9,650-11,000 contains the entire tra (transformer) gene and the very end of the previous gene spd-2 (spindle defective 2).
Note
As described in Module 1, the suffix (e.g., -RA) corresponds to the name of the isoform that is associated with the gene. Hence spd-2-RA corresponds to the A isoform of the spd-2 gene.
- Because the Genome Browser remembers your previous display settings,
we will hide all the evidence tracks and then enable only the subset
of tracks that we need: Click on the
hide allbutton located below the Genome Browser image. Then, configure the display modes as follows:- Under “Mapping and Sequencing Tracks”:
- Base Position:
full
- Base Position:
- Under “Gene and Gene Prediction Tracks”:
- FlyBase Genes:
pack
- FlyBase Genes:
- Click on any of the “refresh” buttons to update the display (Figure 2.1)
- Under “Mapping and Sequencing Tracks”:
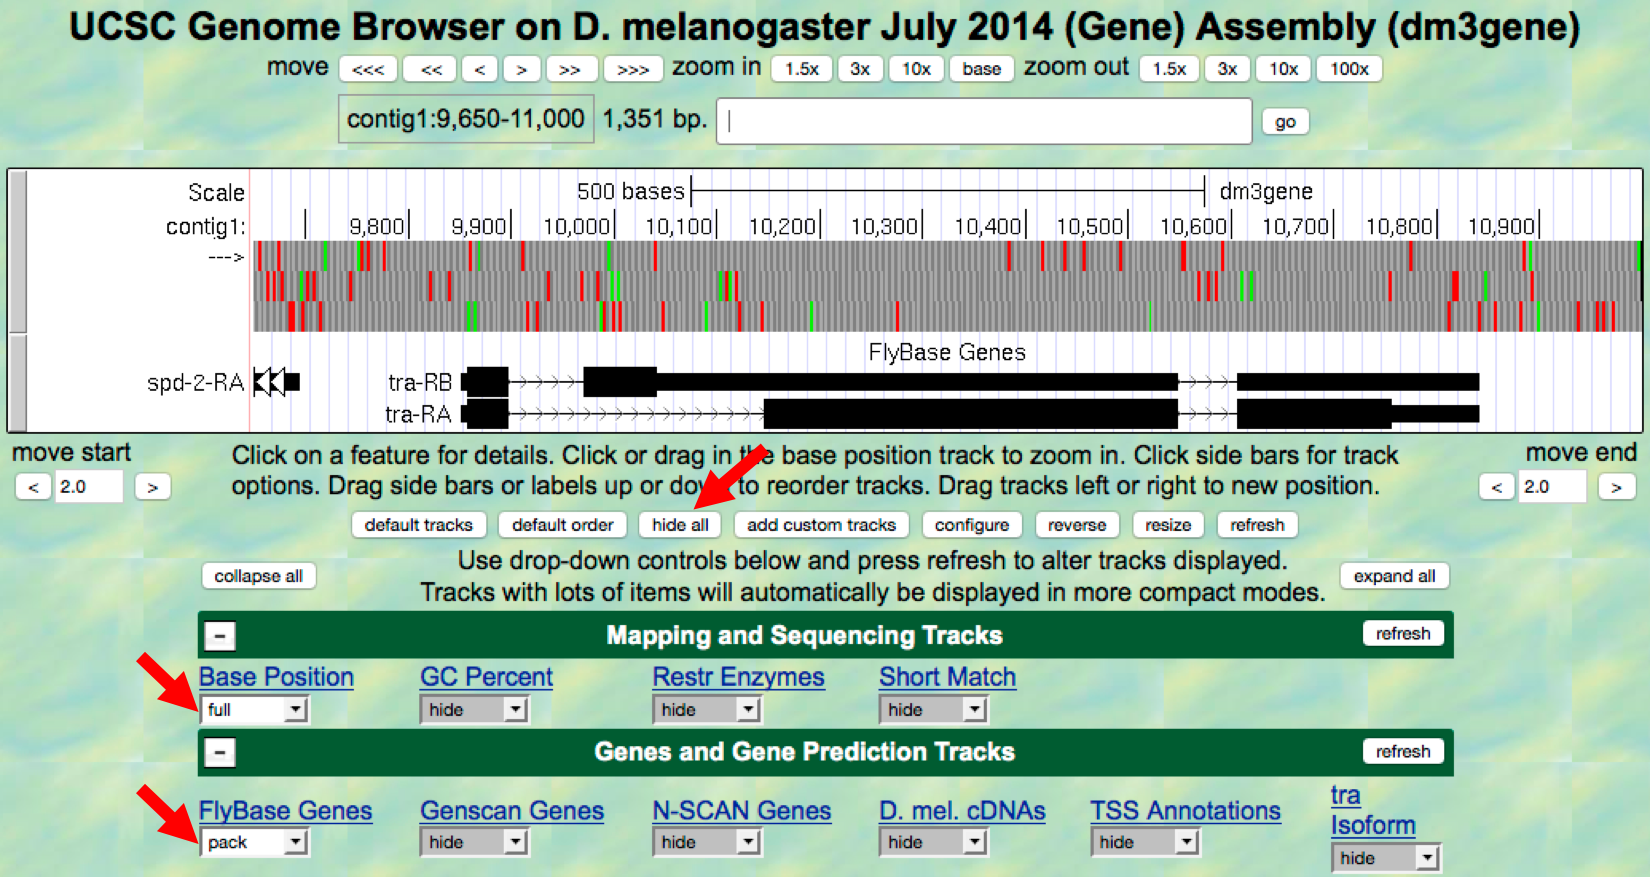
Figure 2.1. Configuring the display modes for the evidence tracks surrounding the tra gene.
Note
Depending on your screen resolution, you may need to zoom in
further to see the nucleotides and amino acid
translations even if you set the “Base
Position” track to full.
2.2.2. Identifying the transcription unit for the tra gene
- Now let’s investigate how the string of As, Ts, Cs, and Gs of the DNA sequence in this genomic region give rise to the mRNAs for the tra gene. The “FlyBase Genes” track shows the protein-coding genes that have been annotated by FlyBase. According to this track, there are actually two different mRNAs (tra-RA and tra-RB) made from the same DNA sequence (Figure 2.2). These represent two alternative forms known as isoforms of the transformer (tra) gene product.
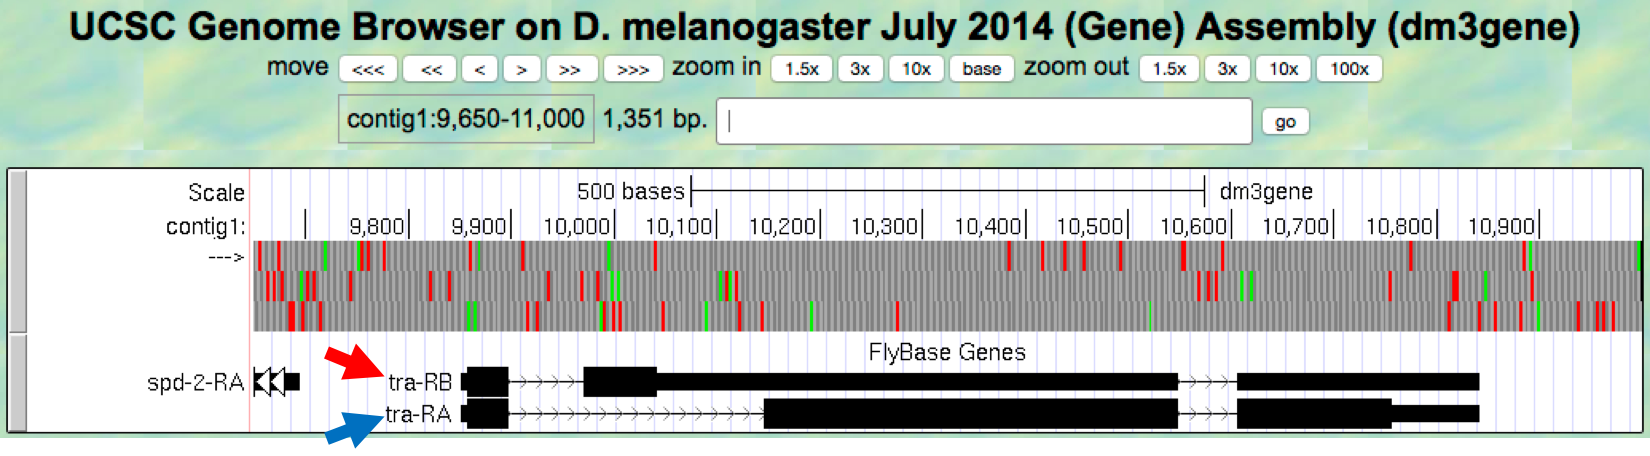
Figure 2.2. FlyBase annotated isoforms A (blue arrow) and B (red arrow) of tra in D. melanogaster.
- For the moment, we will focus only on the A isoform of tra (tra-RA). As you learned in Module 1, the black boxes represent the exons (the part of the transcript that makes up the mRNA); the thick black boxes represent the translated regions (i.e., the parts of the exons that contain information that codes for protein) while the thinner black boxes represent untranslated regions (i.e., the part of the exons that do not contain information that codes for protein). Lines that connect multiple boxes together represent introns, the parts of the transcript that are removed in the production of a mature mRNA. Collectively, they constitute the transcription unit, the part of the gene that is read by RNA polymerase II during transcription.
Note
We use the name “transcription unit” rather than “gene” because genes also contain regulatory sequences (promoters and both positive and negative regulatory elements) that are not transcribed. In contrast to prokaryotes, where most of the transcript codes for protein in a single open reading frame (no introns!), in eukaryotes, the transcript contains a lot of extra nucleotides that are not used to form the protein.
Question 1
What is the span — the start and end base positions — of the tra-RA transcription unit?
- The Genome Browser contains tracks that we can use to visualize the
regions of the DNA that are transcribed into RNA. For example, the
“RNA Seq Tracks” section contains results from sequencing (mostly
mature) mRNAs and then mapping the sequences found in the RNA-Seq
reads back to the genome. Hence regions with RNA-Seq read
coverage usually correspond to regions in the genome that are being
transcribed. To visualize the distribution of these RNA-Seq reads,
scroll down to the bottom of the page and then click on the
RNA-Seq Coveragelink under the “RNA Seq Tracks” section header (Figure 2.3).
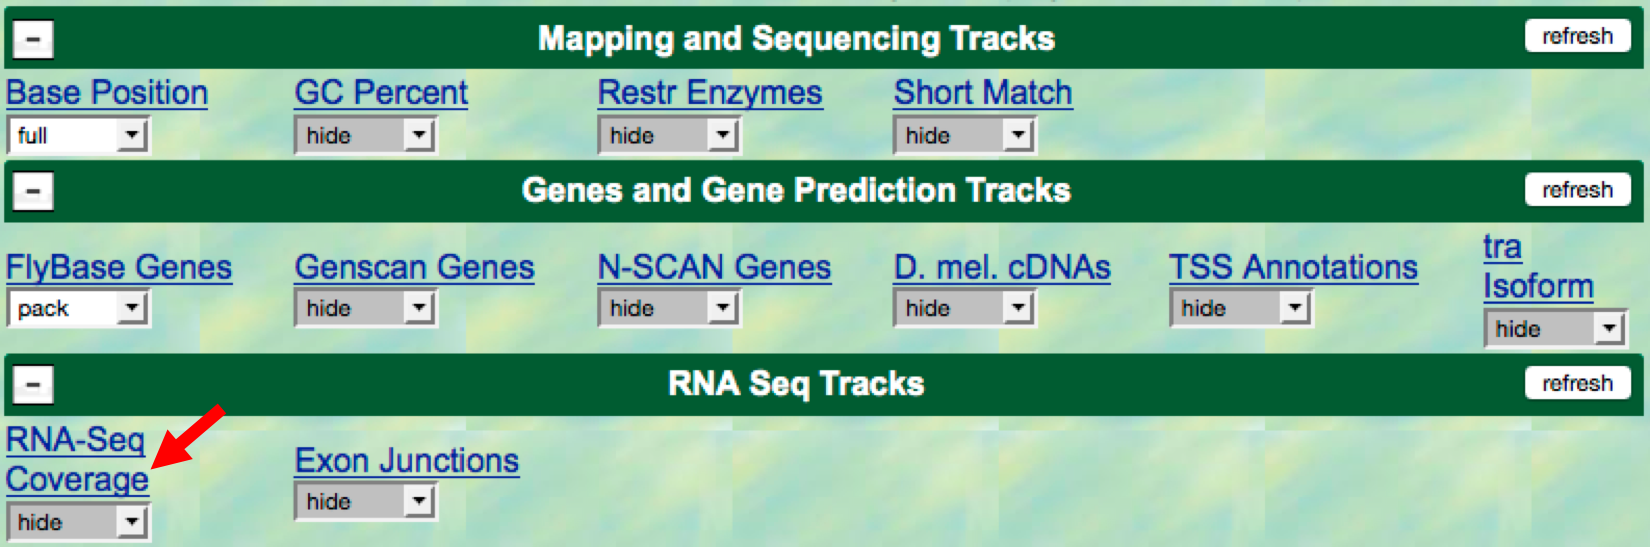
Figure 2.3. Click on the “RNA-Seq Coverage” to configure the display settings for this evidence track.
- Using the controls in the “RNA-Seq Read Coverage” page that comes up
when you click the “RNA-Seq Coverage” link, we will modify the
display settings to the following (Figure 2.4):
- Change the “Display mode” field to
full - Select the “Data view scaling” field to
use vertical viewing range setting - Change the “max” field under “Vertical viewing range” to
37 - Under the “List sub-tracks” section, unselect the
Adult Malestrack - Click on the
Submitbutton (“Display mode” line, near the top of the page)
- Change the “Display mode” field to
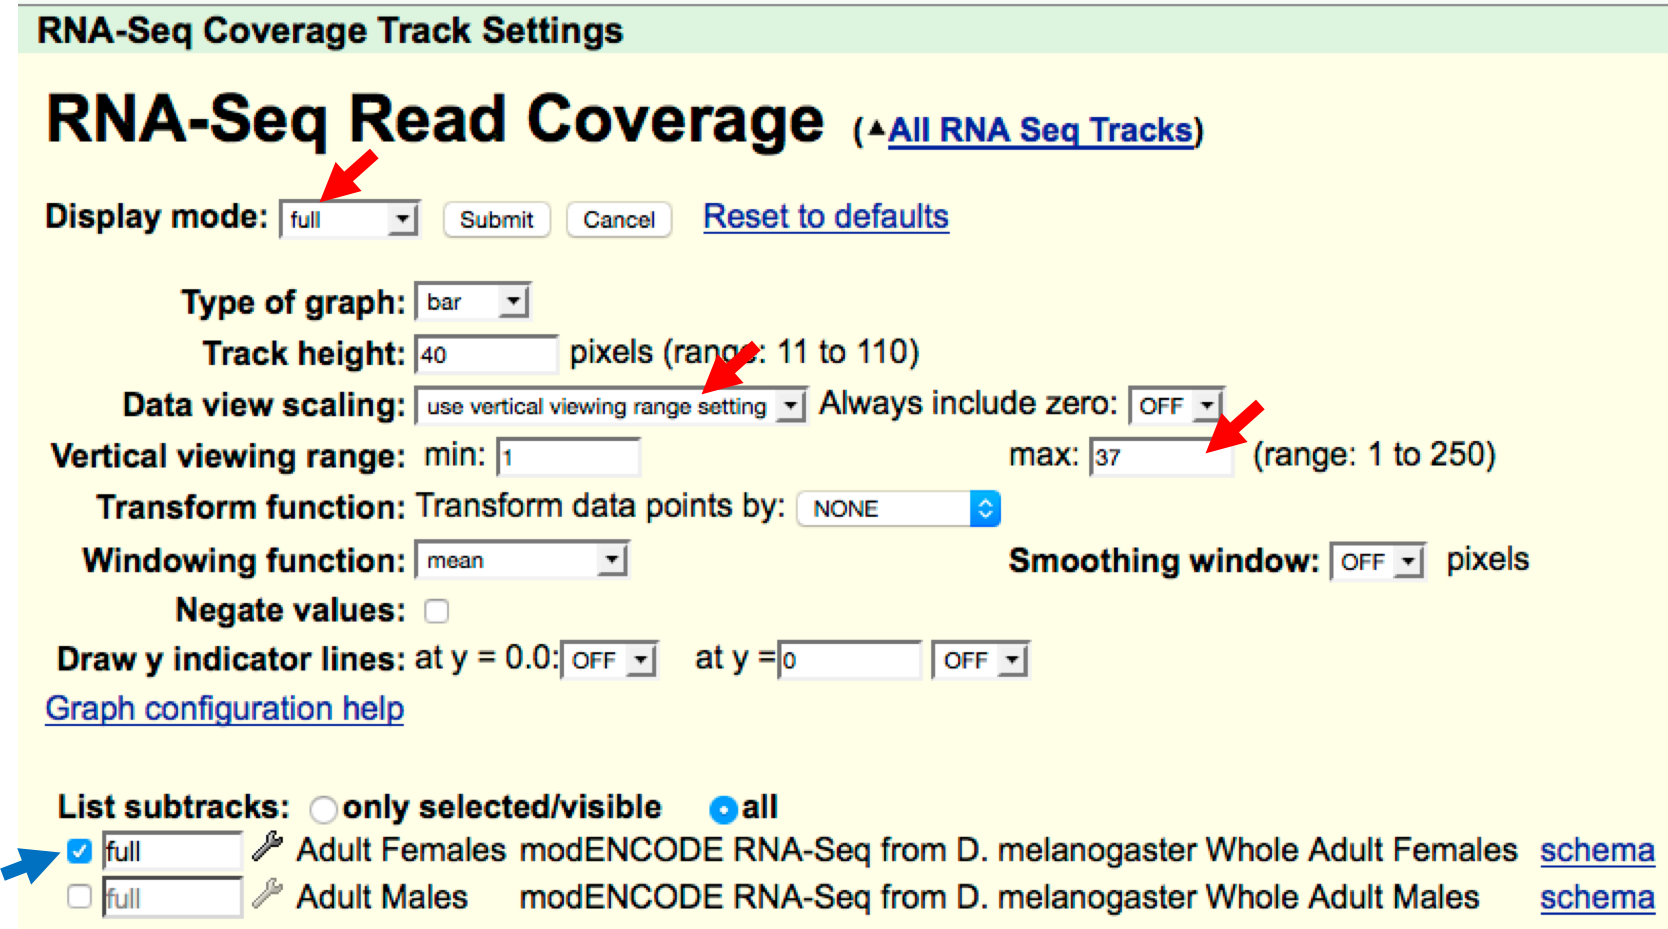
Figure 2.4. Manually define the viewing range for the RNA-Seq Read Coverage track (red arrows) and select only the sub-track of interest (i.e., Adult Females, blue arrow).
Note
By default, the RNA-Seq Coverage track will auto-scale based on the read depth (that is, the number of reads) in the viewing region. The settings above override this setting and manually define the scale to be from 1 to 37. The RNA-Seq Coverage track contains data from mRNA isolated from two separate samples, adult males and adult females. Here we unselect the “Adult Males” track so that the Genome Browser will only show the RNA-Seq read coverage from adult females. We will return to the “Adult Males” track in Module 6.
- The Genome Browser image now includes a track in blue with peaks and valleys, labeled “modENCODE RNA-Seq from D. melanogaster Whole Adult Females” (Figure 2.5). The y-axis corresponds to the number of RNA-Seq reads from whole adult females that have been mapped to each genomic position of this portion of contig1.
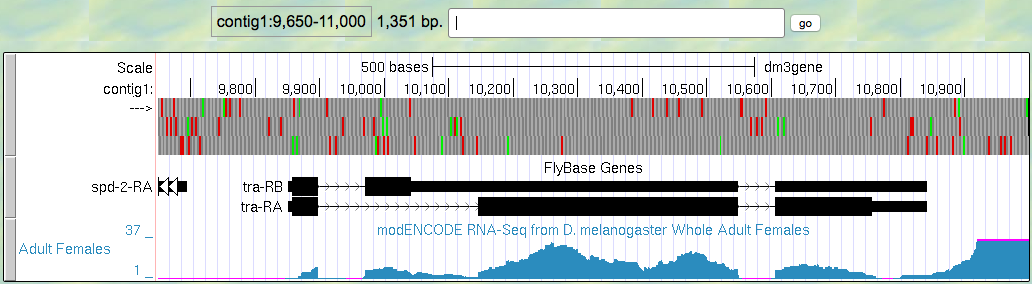
Figure 2.5. RNA-Seq read coverage track (blue) for the D. melanogaster adult female sample.
Question 2
How do the peaks in the RNA-Seq Read Coverage track relate to mRNA abundance?
Summary Question 1
Most of the RNA-Seq reads come from mature (processed) RNA. Can you use this data to suggest where introns are located? Are there any regions that seem ambiguous?
Note
In subsequent modules, we will learn more about the mRNA processing that occurs in the nucleus to remove introns prior to translation.
2.3. Investigation 2: Map the 5’ end of the transcription unit
Learning Objectives
- Predict TSS regions using RNA-Seq data
- Identify putative TSS sites using modENCODE data
- Determine the most likely TSS coordinate by evaluating multiple lines of evidence in the genome browser.
2.3.1. Introduction (Investigation 2)
Previous studies have identified sequence motifs that are enriched in the region surrounding a gene’s Transcription Start Site (TSS). This region is known as the core promoter. By convention, we designate the TSS as +1 and we specify the positions of the sequence motifs with respect to the TSS. For example, the initiator (Inr) motif is found at -2 relative to the TSS (2 bp upstream) while the TATA box motif is found at -31 or -30 relative to the TSS. Both of these motifs are in the same orientation as the transcript (Figure 2.6).
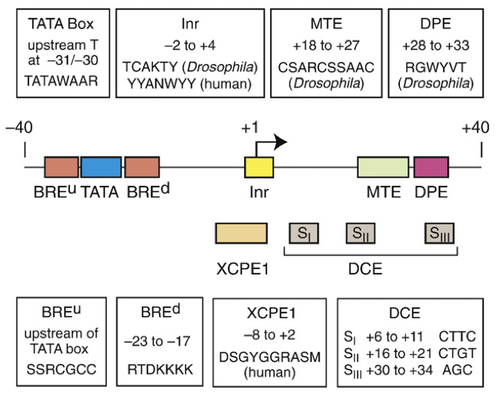
Figure 2.6. Motifs that are enriched near the transcription start sites of many eukaryotic genes (Juven-Gershon T and Kadonaga JT, 2010 [1]). Note that the motifs are often “degenerate,” N = any base, R = purine (either A or G), Y = pyrimidine (C or T), K = keto (T or G), M = amino (C or A), S = strong (G or C), W = weak (A or T), V = A/G/C (not T), D = A/G/T (not C).
2.3.2. Use RNA-Seq data to identify the likely TSS search region
In this module, we will review three lines of evidence to determine the TSS position(s) for the tra gene. Because RNA-Seq identifies regions of the genome that are being transcribed, we will use the RNA-Seq Coverage track to define the scope of the region to search. The start of the region with RNA-Seq read coverage is the 5’ end of the transcript and corresponds to the approximate TSS site, (i.e., the beginning of the transcription unit). RNA-Seq data hence becomes our first line of evidence to try to determine the location of the TSS. In other words, the information gathered from RNA-Seq will be used to support the choice of the TSS. To learn more about RNA-Seq, watch the RNA-Seq and TopHat video.
Question 3
Examine the RNA-Seq Coverage and the FlyBase Genes tracks
in the Genome Browser from left to right. At approximately which
coordinate (base position) does the RNA-Seq data start for the
tra gene?
Tip
Remember that you can use the navigation controls at the top of the page to zoom in to the region of interest.
2.3.3. Use modENCODE data to locate regions enriched with a 5’ cap
One of the first steps in mRNA processing is the addition of the 5’ cap at the beginning of the transcript (we will learn more about capping in the next module). There are experimental techniques that specifically isolate the sequences that are associated with the 5’ cap. These sequences or “reads” can then be mapped against the genomic assembly, and the TSSs will show higher read density than the rest of the genome. The modENCODE project summarizes these experimental data to produce a set of predicted TSSs; these predictions are shown in the “TSS Annotations” track. The TSS annotations predicted by modENCODE constitute our second line of evidence to determine the tra TSS location.
- Before we turn on this track, we will zoom into the region between
the end of the previous gene (spd-2) and the region where we see
RNA-Seq data for tra-RA. Change the “enter position or search terms”
field to
contig1:9,700-9,900and then clickgo. We expect the RNA polymerase to bind and initiate transcription somewhere in this area. Scroll down to the “Gene and Gene Prediction Tracks” section and change the display mode for the “TSS Annotations” track topack. Click on arefreshbutton (Figure 2.7).
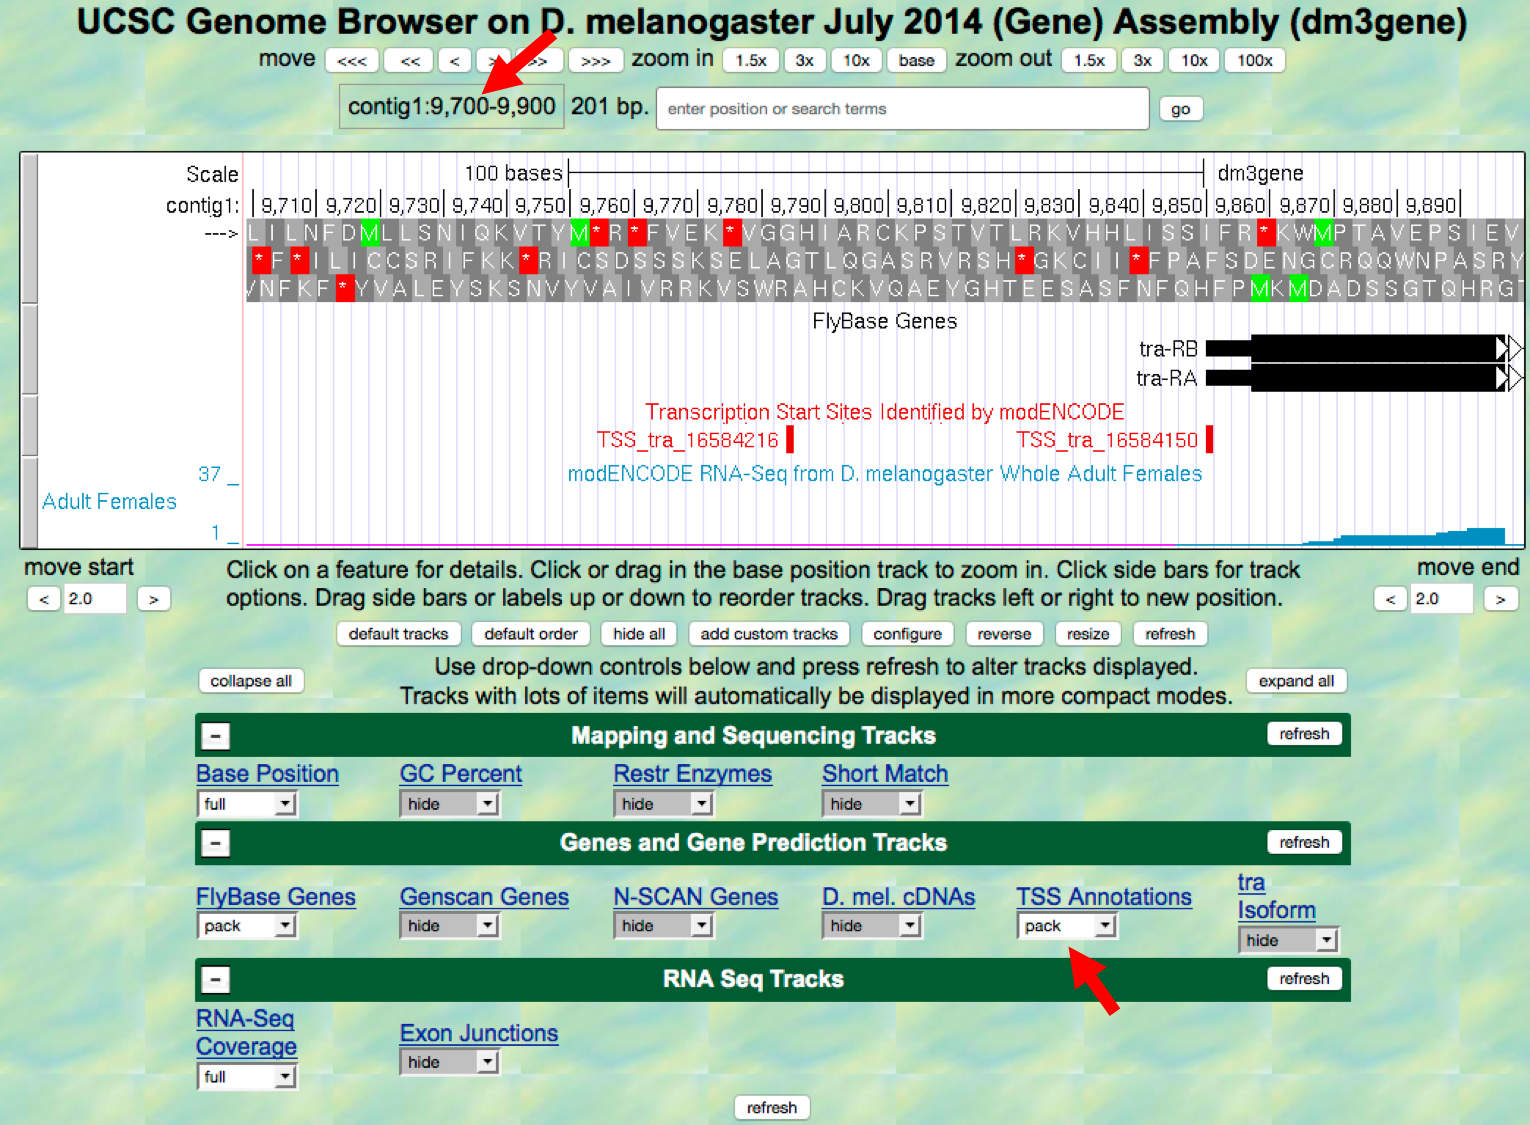
Figure 2.7. Annotated TSS’s in the region surrounding the start of the tra transcripts
Question 4
How many TSS sites were identified using this technique?
Question 5
Look at the labels next to each of the annotated TSSs. What are the labels for the TSS sites?
- We will examine each of the annotated TSS’s separately to determine
their precise coordinates. First, let’s zoom in on the
feature labeled
TSS_tra_16584216so you have about 11 nucleotides in view. Look at the ruler in the “Base Position” track to determine the coordinate for this TSS (Figure 2.8).
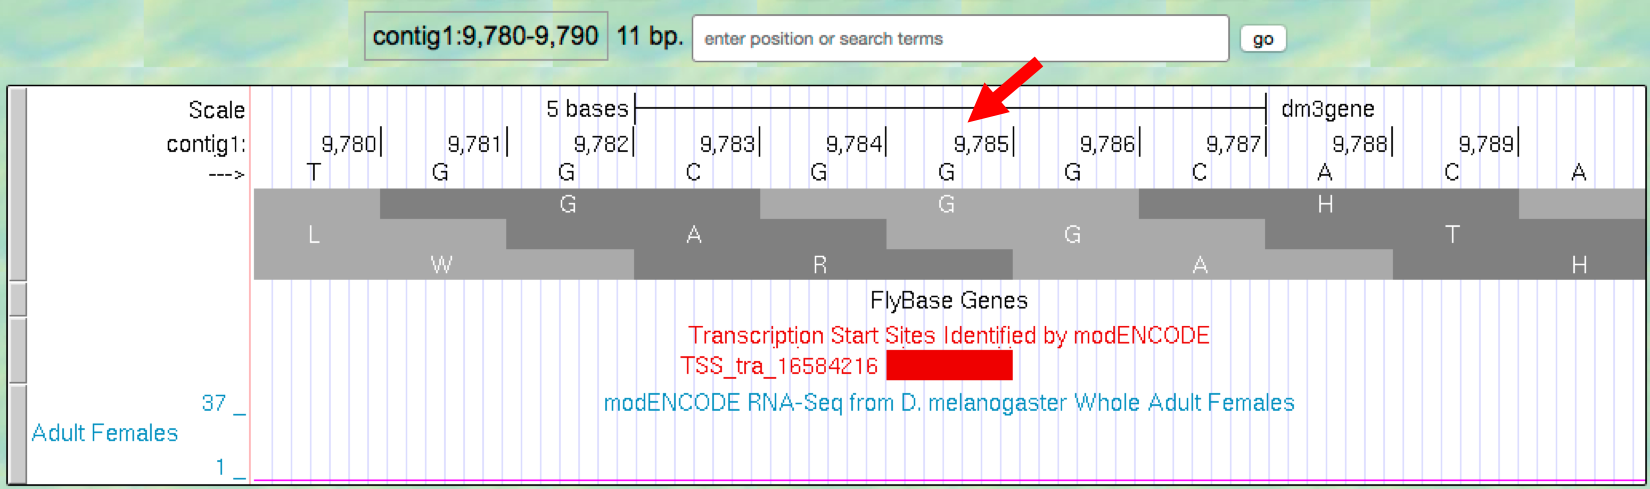
Figure 2.8. Determine the position for the annotated TSS “TSS_tra_16584216”.
Question 6
What is the coordinate for TSS_tra_16584216?
- Now let’s zoom in to the second TSS site,
TSS_tra_16584150(Figure 2.9).
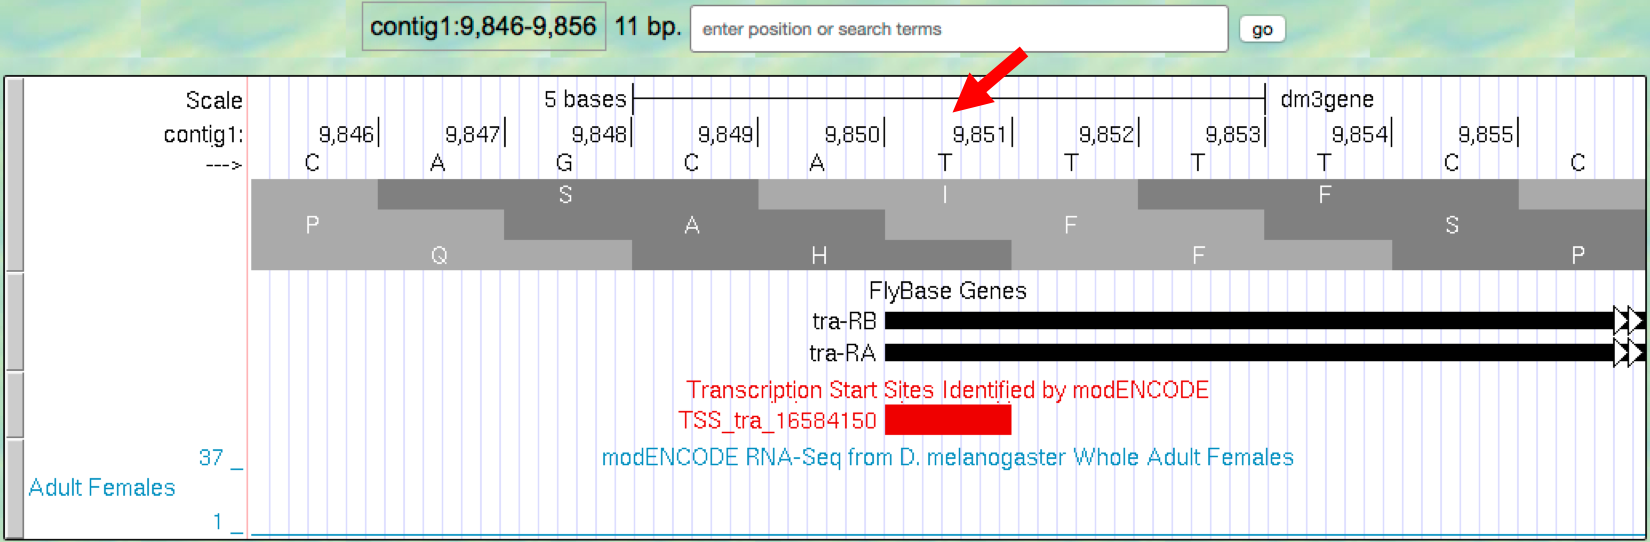
Figure 2.9. Determine the position for the annotated TSS “TSS_tra_16584150”.
Question 7
What is the coordinate for TSS_tra_16584150?
2.3.4. Use the Genome Browser to gather evidence for the most likely TSS
So far, the evidence we have gathered for the location of the TSS from the RNA-Seq data (position 9846) and the modENCODE data (positions 9785 and 9851) are not in complete agreement. This happens frequently with these types of data. Next we will use the Genome Browser to gather additional evidence to identify the most likely TSS.
- First, let’s search for the Inr motif using the
Short Matchfunctionality under “Mapping and Sequencing Tracks”. Change the “enter position or search terms” field tocontig1:9,700-9,900and then clickgo.
Note
- If it is present, we expect the Inr motif to overlap with the TSS (i.e., from -2 to +4 relative to the TSS). The presence of Inr motif in the 5’ region of the gene will be our third line of evidence to support the most likely TSS location.
- To learn more about the Short Match functionality, watch the Short Match video.
- Scroll down to the “Mapping and Sequencing Tracks” section and
click on the
Short Matchlink. Change the “Display mode” field topackand the “Short (2-30 base) sequence” field toTCAKTY(Figure 2.10). Click on theSubmitbutton.
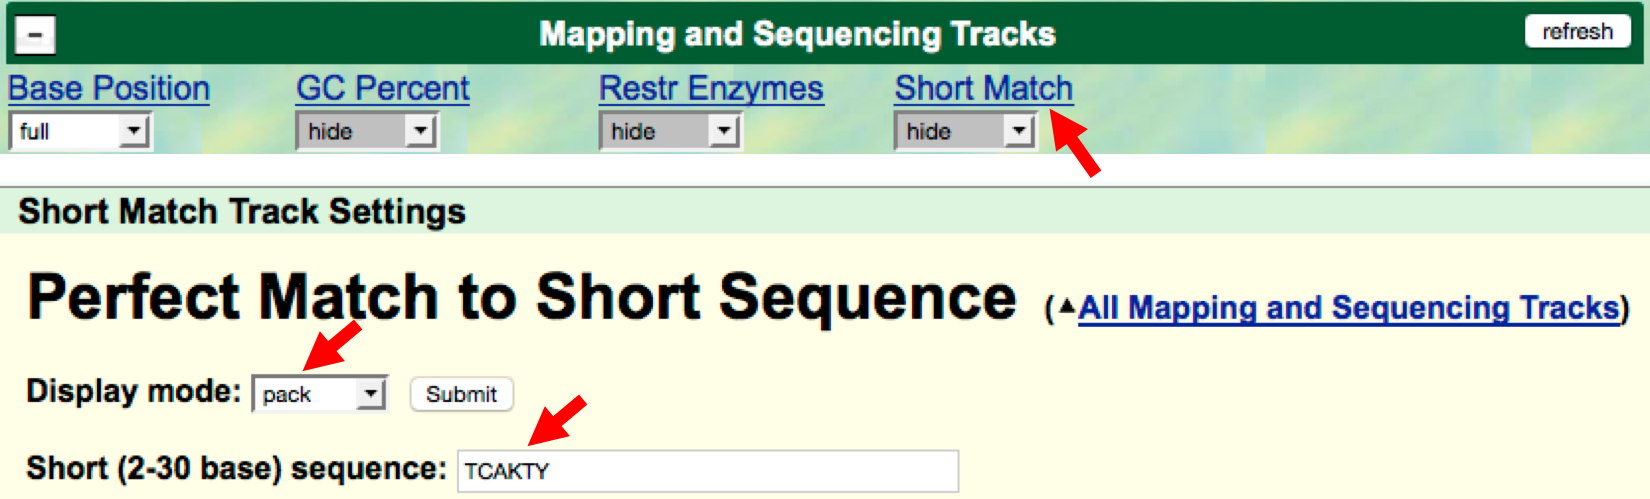
Figure 2.10. Configure the “Short Match” track to search for the Initiator (Inr) motif.
Note
“TCAKTY” is the consensus sequence for the Inr motif, where K (Keto) denotes either G or T and Y (pYrimidine) corresponds to either C or T.
- Each box in the “Perfect Matches to Short Sequence (TCAKTY)” track
corresponds to an instance of the motif. The sign
+or–next to each bar denotes the orientation of the match while the number corresponds to the first base of the motif match.
Question 8
Are there any perfect matches to the Inr consensus sequence in the region between 9,700-9,900? What are the coordinates and orientation of these matches?
Question 9
Which base position(s) would you assign as the TSS of the tra gene based on the available evidence? Describe your reasoning.
Summary Question 2
Is there any ambiguity? In other words, do the three lines of evidence (RNA-Seq tracks, TSS as predicted by the modENCODE data, and the Inr consensus sequence location) point to exactly the same position as being the TSS? If they don’t, why might they differ? Could there be more than one TSS?
Let’s look at a different promoter region. Navigate to the Genome
Browser Gateway page by clicking on the Genomes tab at the top of the
page, and select the D. melanogaster Aug. 2014 (BDGP Release 6 +
ISO1 MT/dm6) assembly. Change the “Position/Search Term” field to
chr2R:18,867,350-18,867,430 and then click on the GO button.
Click on
hide alland then enable the following tracks under “Mapping and Sequencing Tracks”:- Base Position:
full - Short Match:
pack
- Base Position:
Search for TCAKTY, the Inr consensus sequence.
- Click on the
Short Matchlink under “Mapping and Sequencing Tracks.” - Type
TCAKTYin the “Short (2-30 base) sequence” field. - Click on the
submitbutton.
- Click on the
Under “Genes and Gene Predictions Tracks”:
- FlyBase Genes:
pack
- FlyBase Genes:
Under “Expression and Regulation”:
- TSS (Embryonic) (R5):
pack - Click on a
refreshbutton. Record the position(s) and orientation(s) of any matches to the Inr motif. - Repeat the search for
TATAWAAR(the TATA Box motif).
- TSS (Embryonic) (R5):
Summary Question 3
Are there any perfect matches to the Inr consensus sequence (Figure 2.11)? What are the coordinates and orientation of these matches? What about the TATA Box motif? Are these signals in good agreement with the beginning of the transcription unit?
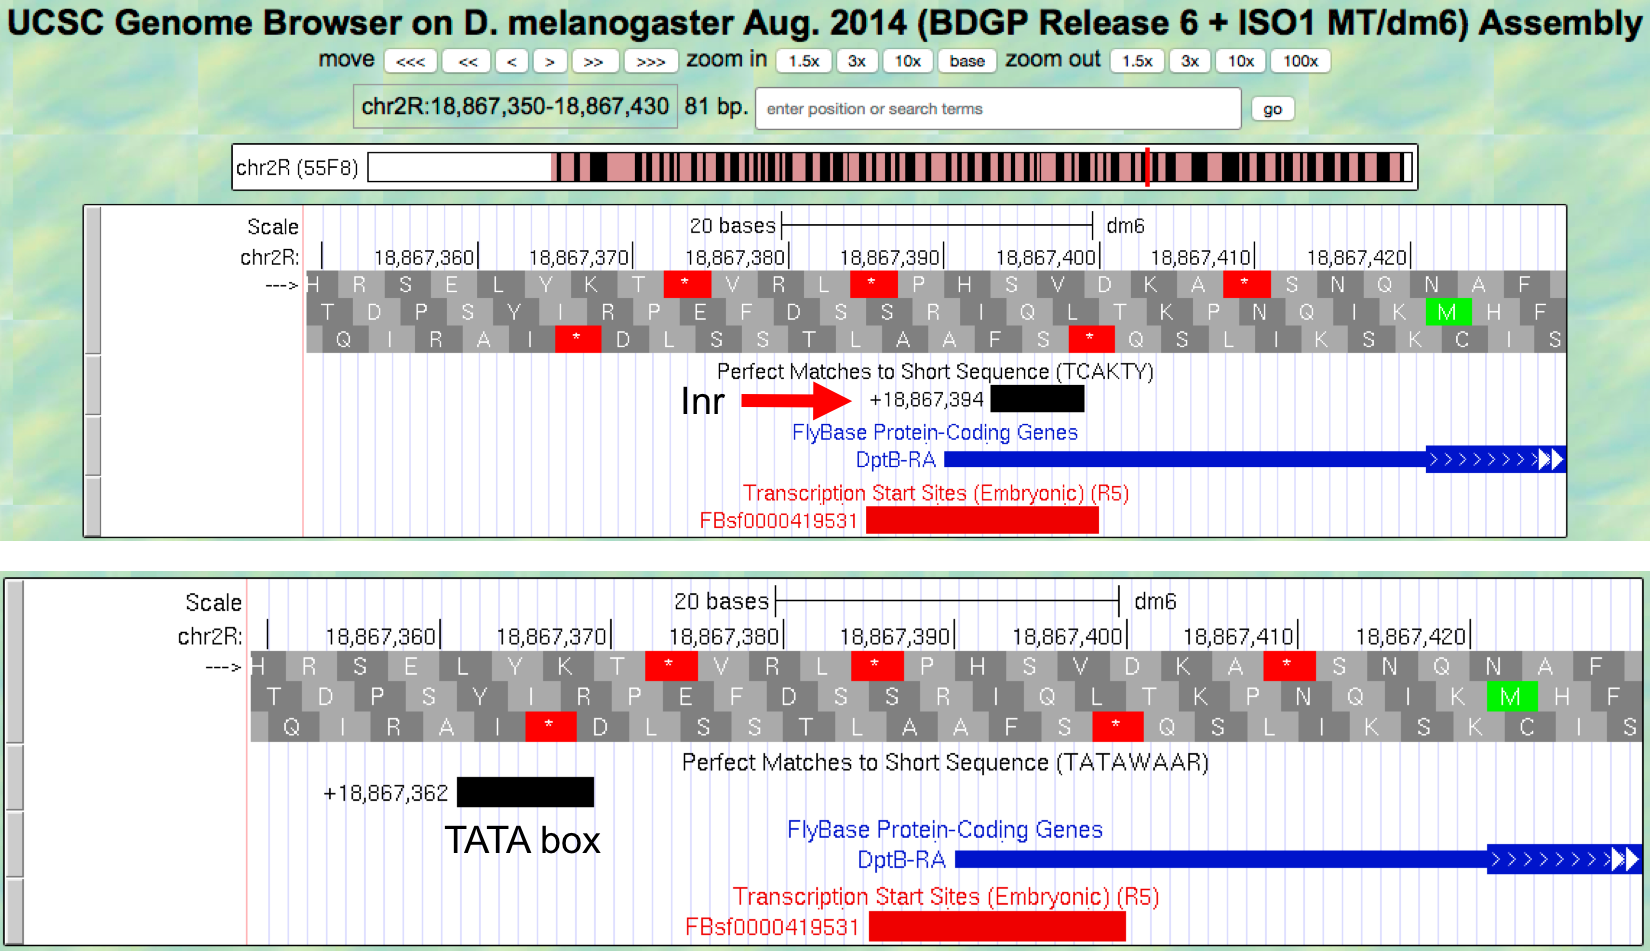
Figure 2.11. Use of the “Short Match” track to search for the Inr and TATA box motifs.
2.4. Investigation 3: Map the 3’ end of the transcription unit
Learning Objectives
- Predict the approximate end of a transcription unit using RNA-seq data
- Identify the most likely termination signal using the genome browser
2.4.1. Introduction (Investigation 3)
After RNA polymerase II has started transcribing a gene (initiation), generally with the help of various transcription factors, it will proceed (in a process called elongation) all the way to the termination signal in order to produce a molecule of pre-mRNA. Let’s review what we know about the template, and then consider termination.
RNA polymerase II will use the template DNA to synthesize a primary transcript (pre-mRNA) by pairing purine bases with pyrimidine bases. Actually, the sequence of nucleotides that you observe on the tracks in the Browser corresponds to the “coding strand” of the DNA (complementary to the template strand); the coding strand is almost identical to that pre-mRNA, except that DNA has thymine versus RNA, which has uracil as the pyrimidine base that pairs with A.
Because DNA is antiparallel, if the coding strand that you see in the browser track runs 5’ to 3’, then the template strand runs in the 3’ to 5’ direction.
RNA polymerase binds to the promoter sequence on the template strand, constructing the transcribed mRNA in the 5’ to 3’ direction, just like the coding DNA strand that you see on the tracks. In fact, polymerases can only add nucleotides to the 3’ end (free –OH) of the growing RNA molecule.
Termination of mRNA transcription is different in eukaryotes than in prokaryotes. In eukaryotes, RNA polymerase II passes through one or more AATAAA sequences, which lie beyond the 3’ end of the coding region (i.e., thick black boxes in the FlyBase Genes track). The pre-mRNA molecule will thus carry the signal AAUAAA. This AAUAAA signal is recognized by a special endonuclease that cuts at a site 11 to 30 nucleotides to its 3’ side. As you will learn in the mRNA processing module, a tail of polyriboadenylic acid, poly(A), is added by a special non-template-directed polymerase to the end of the transcript.
Pre-mRNA processing will be further studied in Module 3 and Module 4.
Note
The AATAAA sequence is also referred to as the poly-A signal because a poly-A tail is added to the mRNA at its 3’ end. Hence the next Module will use the term poly-A signal to refer to the AATAAA sequence.
2.4.2. Identify termination signal at the 3’ end of the transcription unit
- We will try to identify the approximate end of the tra-RA transcript
using the RNA-Seq data, and will then search the DNA sequence for a
termination signal (AATAAA). Return to the
July 2014 (Gene)assembly, change the “search terms” field tocontig1:10,700-10,950and then clicksubmitto navigate to the 3’ end of the tra gene. Examine the RNA-Seq read density in the “RNA-Seq Coverage” track (Figure 2.12).
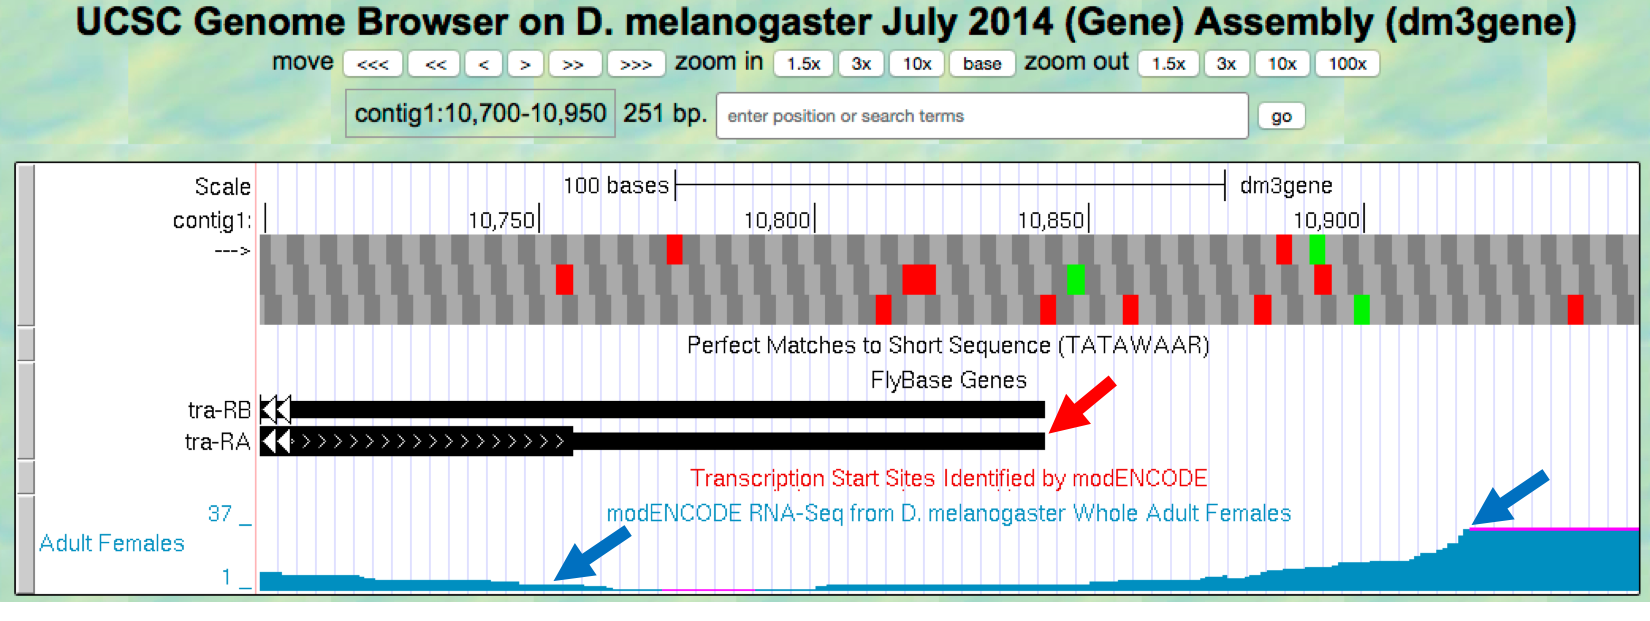
Figure 2.12. Comparison of the transcription end site annotated by FlyBase (red arrow) versus changes in RNA-Seq read coverage in whole adult females (blue arrows).
Question 10
At which base position do you see the RNA-Seq read coverage ending in the whole adult female sample? [Zoom in close to the beginning of the pink area (no RNA-Seq coverage) in the RNA-Seq track.]
Question 11
What is the coordinate of the 3’ end of the tra-RA transcript
according to the FlyBase Gene track? (You will need to zoom in
on the end of the FlyBase Gene track.)
Tip
You may observe that after decreasing, the amount of RNA-Seq reads in this region starts to increase again, continuing at a higher level to the end of the contig. This is because there is another gene downstream (to the right) very close to tra. We can ignore the region (starting at around position 10,900) where the RNA-Seq reads increase.
- We will now look for a termination signal in this 3’ region of the
tra gene. As we did when searching for the Inr consensus sequence,
we can use the “Short Match” functionality to search for the
AATAAAsequence. - Click on the
Short Matchlink under the “Mapping and Sequence Tracks” section. Verify that the “Display mode” is set topackand enter the sequenceAATAAAinto the “Short (2-30 base) sequence” field (Figure 2.13). Click on theSubmitbutton.
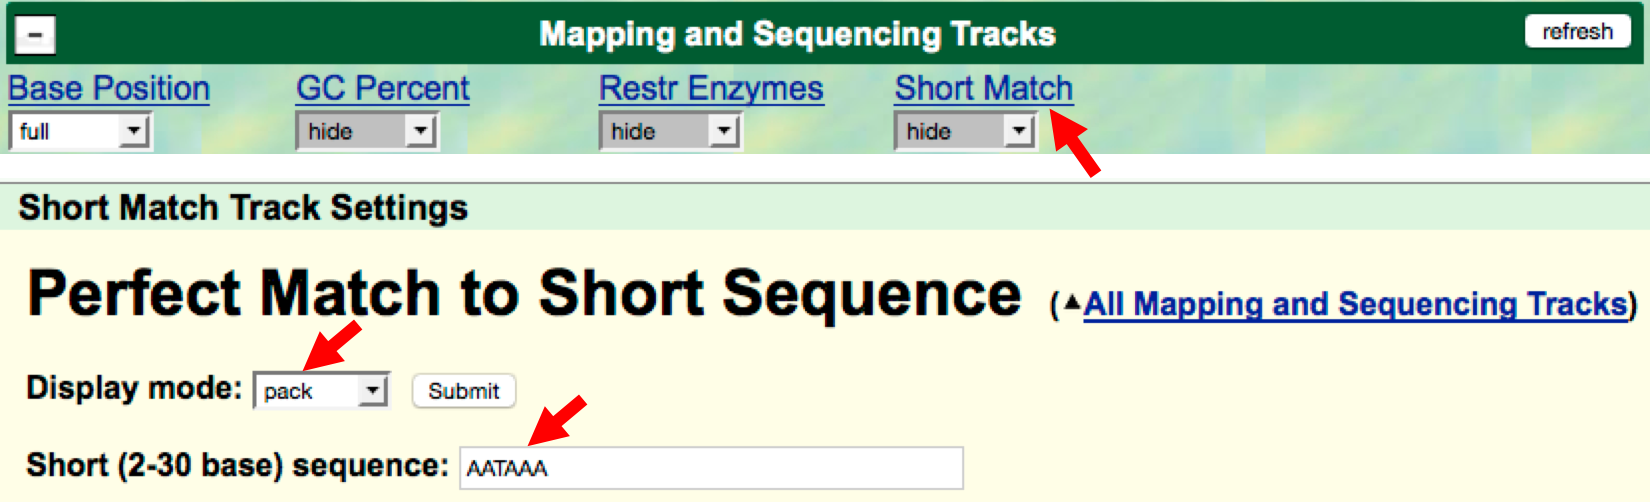
Figure 2.13. Use the “Short Match” track to search for the mRNA termination signal.
Question 12
How many matches are there in the search region (contig1:10,700-10,950)?
Question 13
How many of these matches are on the positive (+) strand of the DNA? Remember these sequences, like the Inr consensus sequence we discussed before, are strand-specific and your gene is on the + strand.
Question 14
Is the sequence(s) you found in the question above contained within the 3’ untranslated region of the transcript?
Tip
Remember from Module 1 that the thick black boxes in the “FlyBase Genes” track represent coding (translated) regions while the thin black boxes represent non-coding (untranslated) regions.
Summary Question 4
Based on your analysis above, which position is the best choice for the termination signal? Describe your reasoning.
2.5. Summary
In this lesson, you have seen how the primary transcript (the mRNA molecule) is produced from the template DNA by an RNA polymerase interpreting different signals on the DNA. We saw that DNA sequences upstream of the 5’ end (promoter) and near the 3’ end (terminator) are important parts of the transcription unit. The pre-mRNA molecule from the TSS site to the termination signals will undergo several modifications (processing) in addition to capping that you will learn about in the next few modules.
As discussed above, the reads produced by an RNA-Seq experiment are derived primarily from processed mRNA (not the pre-mRNA). Hence, we can explore several additional questions using the RNA-Seq Coverage track:
Summary Question 5
Do you see any correlation between the areas with high RNA-Seq read coverage (high peaks) and the different boxes in the tra-RA isoform? Zoom out 10X to get an overview. Remember that the thick boxes correspond to the coding regions, the thin boxes are the untranslated regions, and the lines with arrows are introns.
Summary Question 6
Where do you see regions in the RNA-Seq coverage data with no coverage at all?
Summary Question 7
If these regions with no RNA-Seq coverage occur within an initial transcript, what could have happened to these RNA sequences?