1. Module 1
Module 1: Introduction to the Genome Browser: What is a Gene?
| Author: | Joyce Stamm (University of Evansville) |
|---|---|
| Last Update: | Feb 24, 2020 |
| Version: | 0.0.1 |
1.1. Introduction to the Genome Browser
Learning Objectives
- Use the navigation tools in the genome browser to zoom in and zoom out on a given region and identify the genes in that region.
Genes encode information that our cells use to carry out their functions. In particular, protein-coding genes provide the cell with the information to make messenger RNAs (mRNAs), which are then used to make proteins. In this module, we will use a web-based visualization tool called a Genome Browser to explore the structure of a eukaryotic gene, and obtain a basic understanding of how this information is stored and used. In subsequent modules, you will learn more about the details of these biological processes, and use the Genome Browser to examine the experimental data that provide evidence for a detailed gene structure. The protein-coding genes in eukaryotes (higher organisms, with a cell nucleus) are much more complex than the protein-coding genes in prokaryotes (bacteria, organisms without a nucleus). We are still trying to figure out all of the details!
- Start by watching the Genome Browser video
- Open a web browser and navigate to a custom version of the Genome
Browser. The browser was developed by the Genome Bioinformatics Group
at the University of California Santa Cruz (UCSC). The custom version
is at http://gander.wustl.edu. Click on the
Genome Browserlink on the left menu (Figure 1.1).
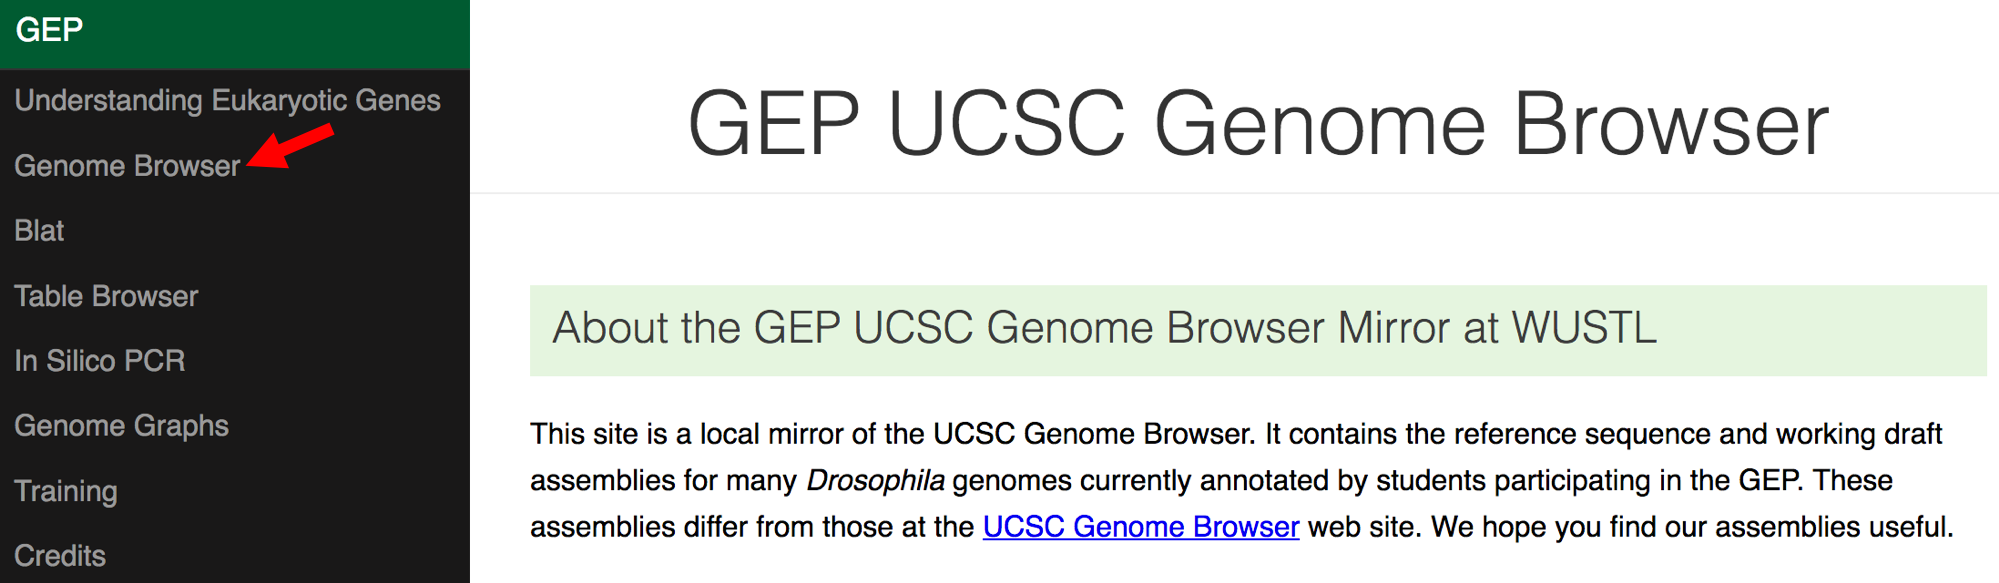
Figure 1.1. Access the Genome Browser gateway page using the “Genome Browser” link.
- Change the following fields in the “Genome Browser Gateway” section
(Figure 1.2):
- Select
D. melanogasterunder the “REPRESENTED SPECIES” field. This will allow you to view the genome of the insect Drosophila melanogaster. - Confirm that
Aug. 2014 (BDGP Release 6 + ISO1 MT/dm6)is in the “Assembly” field. This is the version of the D. melanogaster genome that you will view. The genome assembly is simply the genome sequence produced after chromosomes have been fragmented, those fragments have been sequenced, and the resulting sequences have been put back together. A genome assembly is updated when DNA has been sequenced that allows gaps to be filled. It may also be updated when a new assembling algorithm is released. The August 2014 Drosophila melanogaster (BDGP Release 6 + ISO1 MT/dm6) assembly was produced by the Berkeley Drosophila Genome Project (BDGP). - Enter
chr3Linto the “Position/Search Term” text box so that you can view the left (L) arm of chromosome 3 (chr3).
- Select
- Click on the
GObutton.
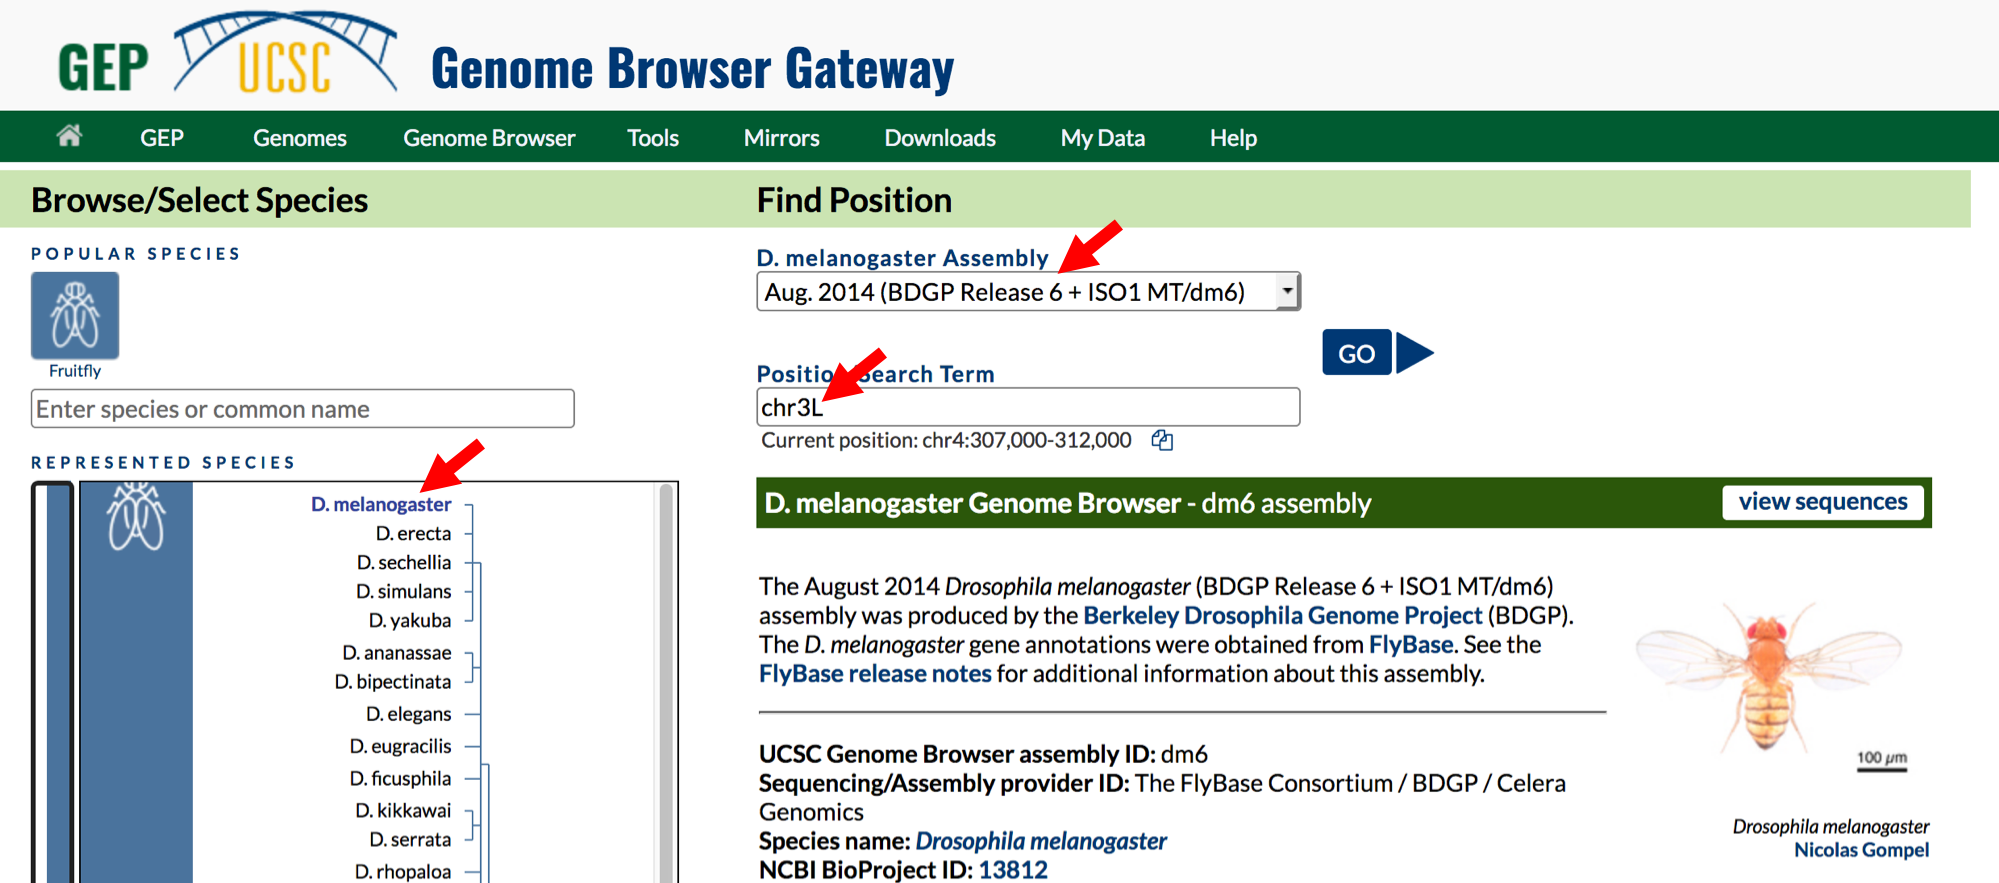
Figure 1.2. Configure the Genome Browser Gateway page to view the sequence for the left arm of chromosome 3 in D. melanogaster.
- The next screen can be divided into four major sections
(Figure 1.3):
- A top green toolbar is used to navigate to the different tools provided by the Browser.
- Navigation Controls allow us to navigate or zoom to different parts of the genome.
- A genomic features panel (the white area) shows the locations of the different genomic features within the portion of the genome (e.g. chr3L) specified by the label next to the “enter position or search terms” text box
- A Display Controls section may be used to manipulate how much detail
is visible in the genomic features panel of the Genome Browser.
To match the screenshot in Figure 1.3:
- Scroll down in this section to the bar labeled “Mapping and
Sequencing Tracks”, go to “Base Position”, and select
densefrom the drop-down menu. - Scroll down to “Genes and Gene Prediction Tracks”, go to
“FlyBase Genes” and select
squishfrom the drop-down menu. - Check that all other tracks are set to
hide, and then click on anyrefreshbutton to update the genomic features panel.
- Scroll down in this section to the bar labeled “Mapping and
Sequencing Tracks”, go to “Base Position”, and select
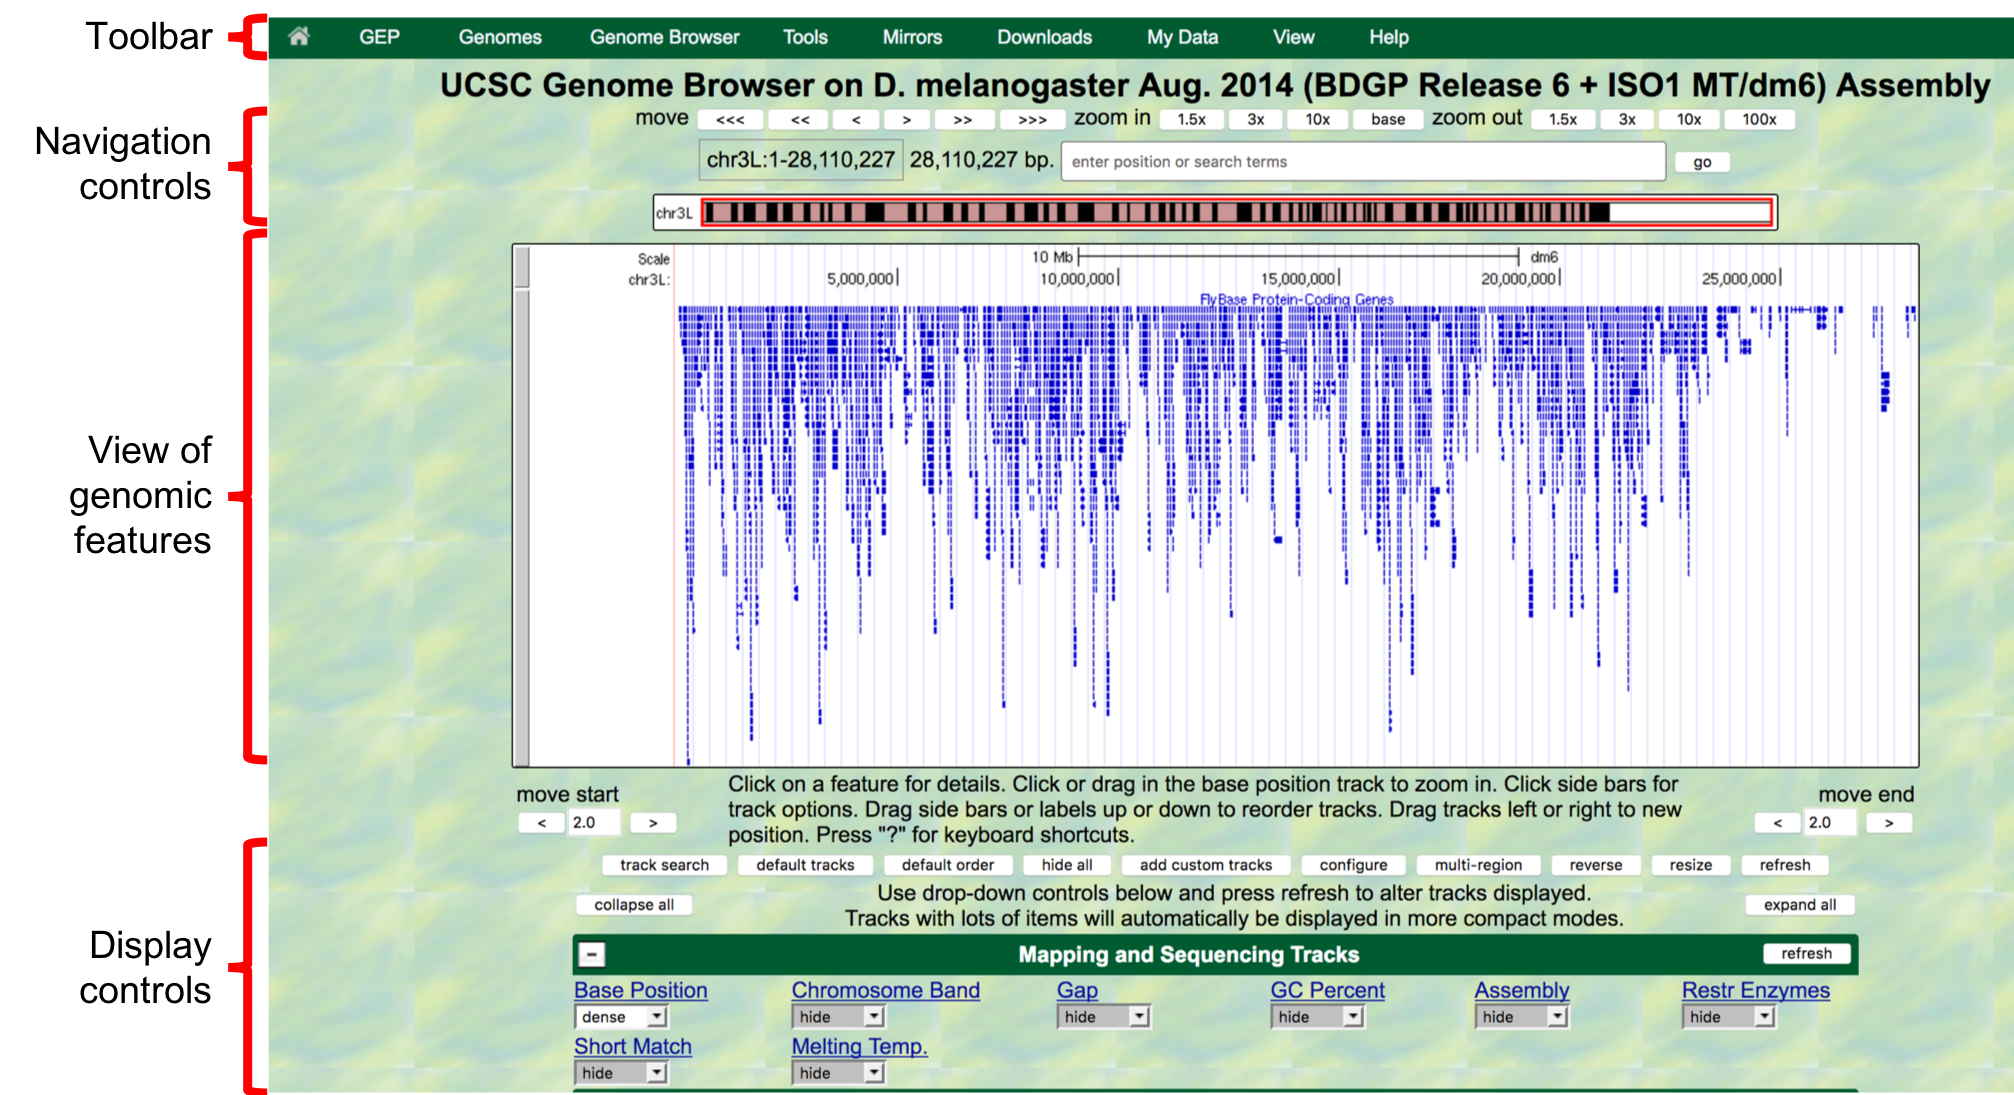
Figure 1.3. The four major sections of the Genome Browser.
You can use the buttons in the “Navigation control” section to navigate to different parts of the genome. You can zoom in to a region by clicking on one of the buttons next to the “zoom in” label (i.e. 1.5x, 3x, 10x, base). Similarly, you can zoom out by clicking on the buttons next to the “zoom out” label. Alternatively, you can enter the genome coordinates into the “enter position or search terms” field and then click on the “go” button to navigate to a specific region in the genome assembly.
The “size” field next to the “enter position or search terms” text box (red arrow in Figure 1.4) shows the total size of the genomic region that you are viewing. In this case, the “size” field shows that chr3L (i.e. the left arm of chromosome 3) in Drosophila melanogaster has a total length of ~28 million base pairs (bp). We will learn more about the key functionalities of the Genome Browser in subsequent modules. For now, we will focus on the large white rectangle shown on this page; this contains a graphical representation of the genomic features (e.g. protein coding genes, percent GC content) of chr3L mapped against the DNA sequence, which is embedded in the top line of the white box.
The different types of features (also known as “tracks” or “evidence tracks”) are separated by a title and are often shown in different colors. What types and how many tracks are shown in the view of genomic features is controlled by the display controls at the bottom. The view shown on Figure 1.4 displays only some of tracks in the “Gene and Gene Prediction tracks”, and all the other tracks in other sections (transgenic insertions, chromatin domains, ChIP seq tracks, Expression and Regulation, etc.) are “hidden”. More information about evidence tracks is available in the Tracks video.
We can examine the region under the blue title labeled “FlyBase Protein-Coding Genes” to estimate the number of protein-coding genes on chr3L. In this track each gene is represented by a set of blue boxes connected by thin blue lines. There are clearly fewer blue boxes at the right side of the image compared to the left, which suggests that genes are not uniformly distributed along the chromosome (Figure 1.4).
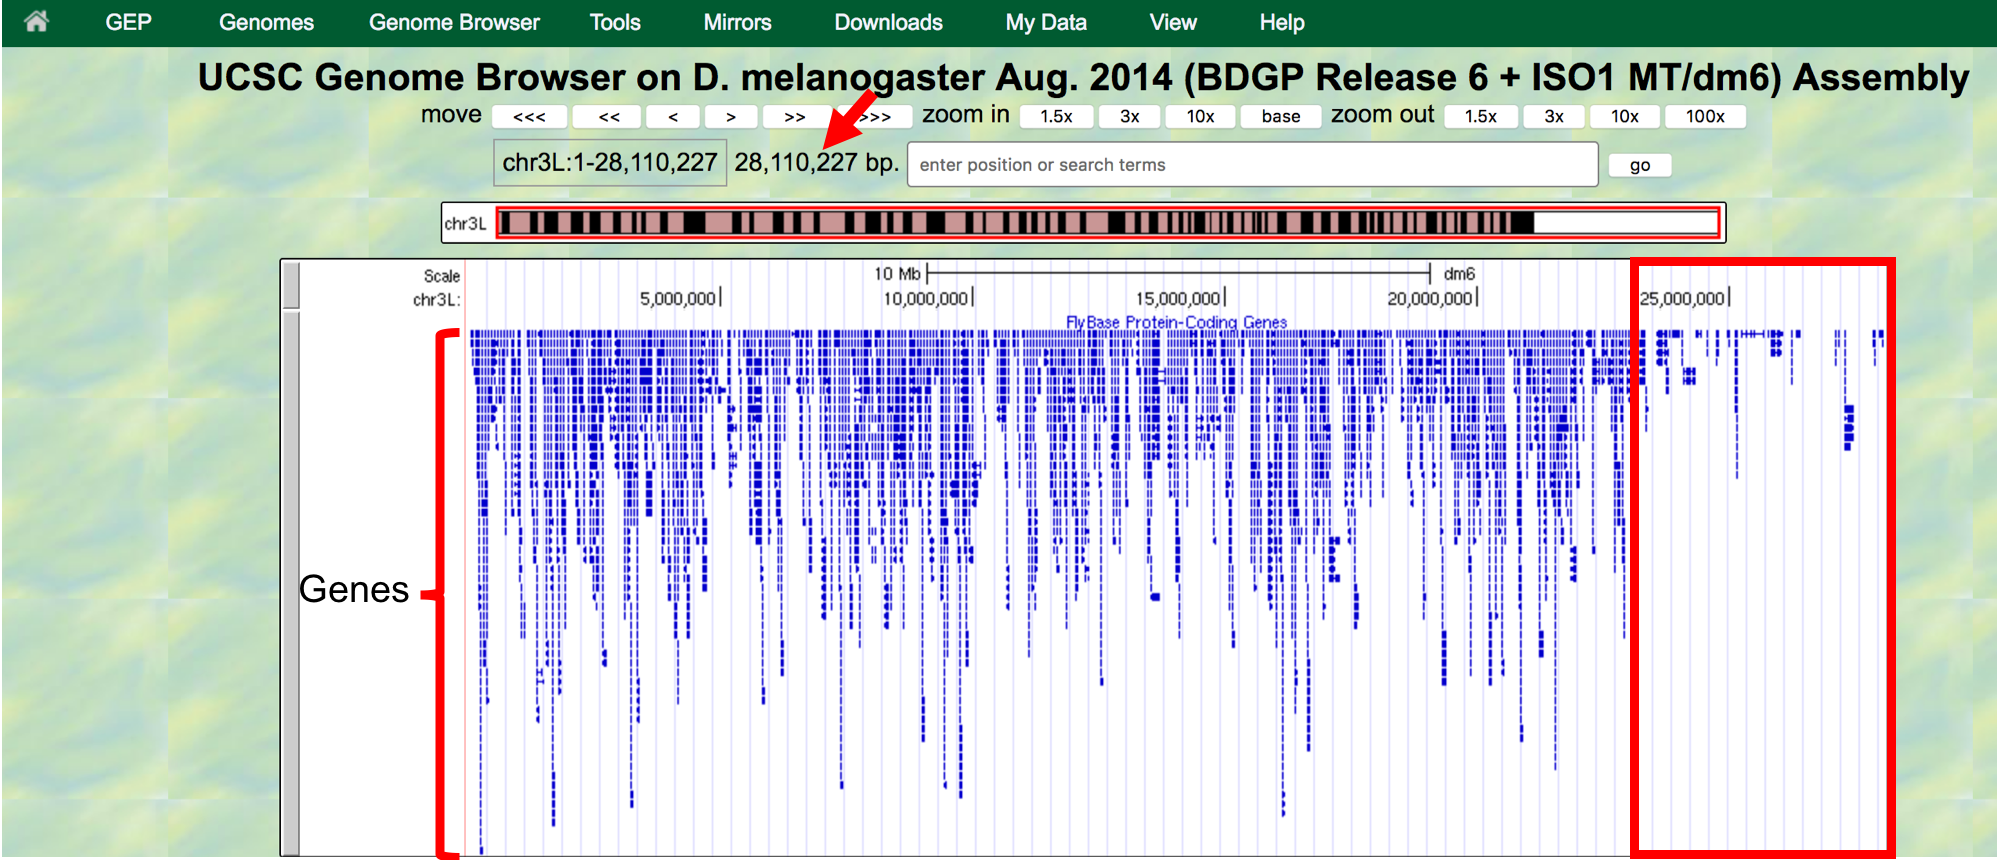
Figure 1.4. Genome Browser shows that the entire D. melanogaster chr3L sequence has a length of ~28 million base pairs (red arrow) and that the right end of the chromosome has low gene density (red box).
In the genome browser, each chromosome may be organized into smaller projects called contigs (for contiguous sequences). In this next part, we will examine contig1, a much shorter region in the left arm of chromosome 3.
- Click on the
Genomeslink on the top toolbar to return to the Genome Browser Gateway page. - Change the assembly option to
July 2014 (Gene)and verify that the “position” field has been set tocontig1(Figure 1.5). - Click on the
GObutton.
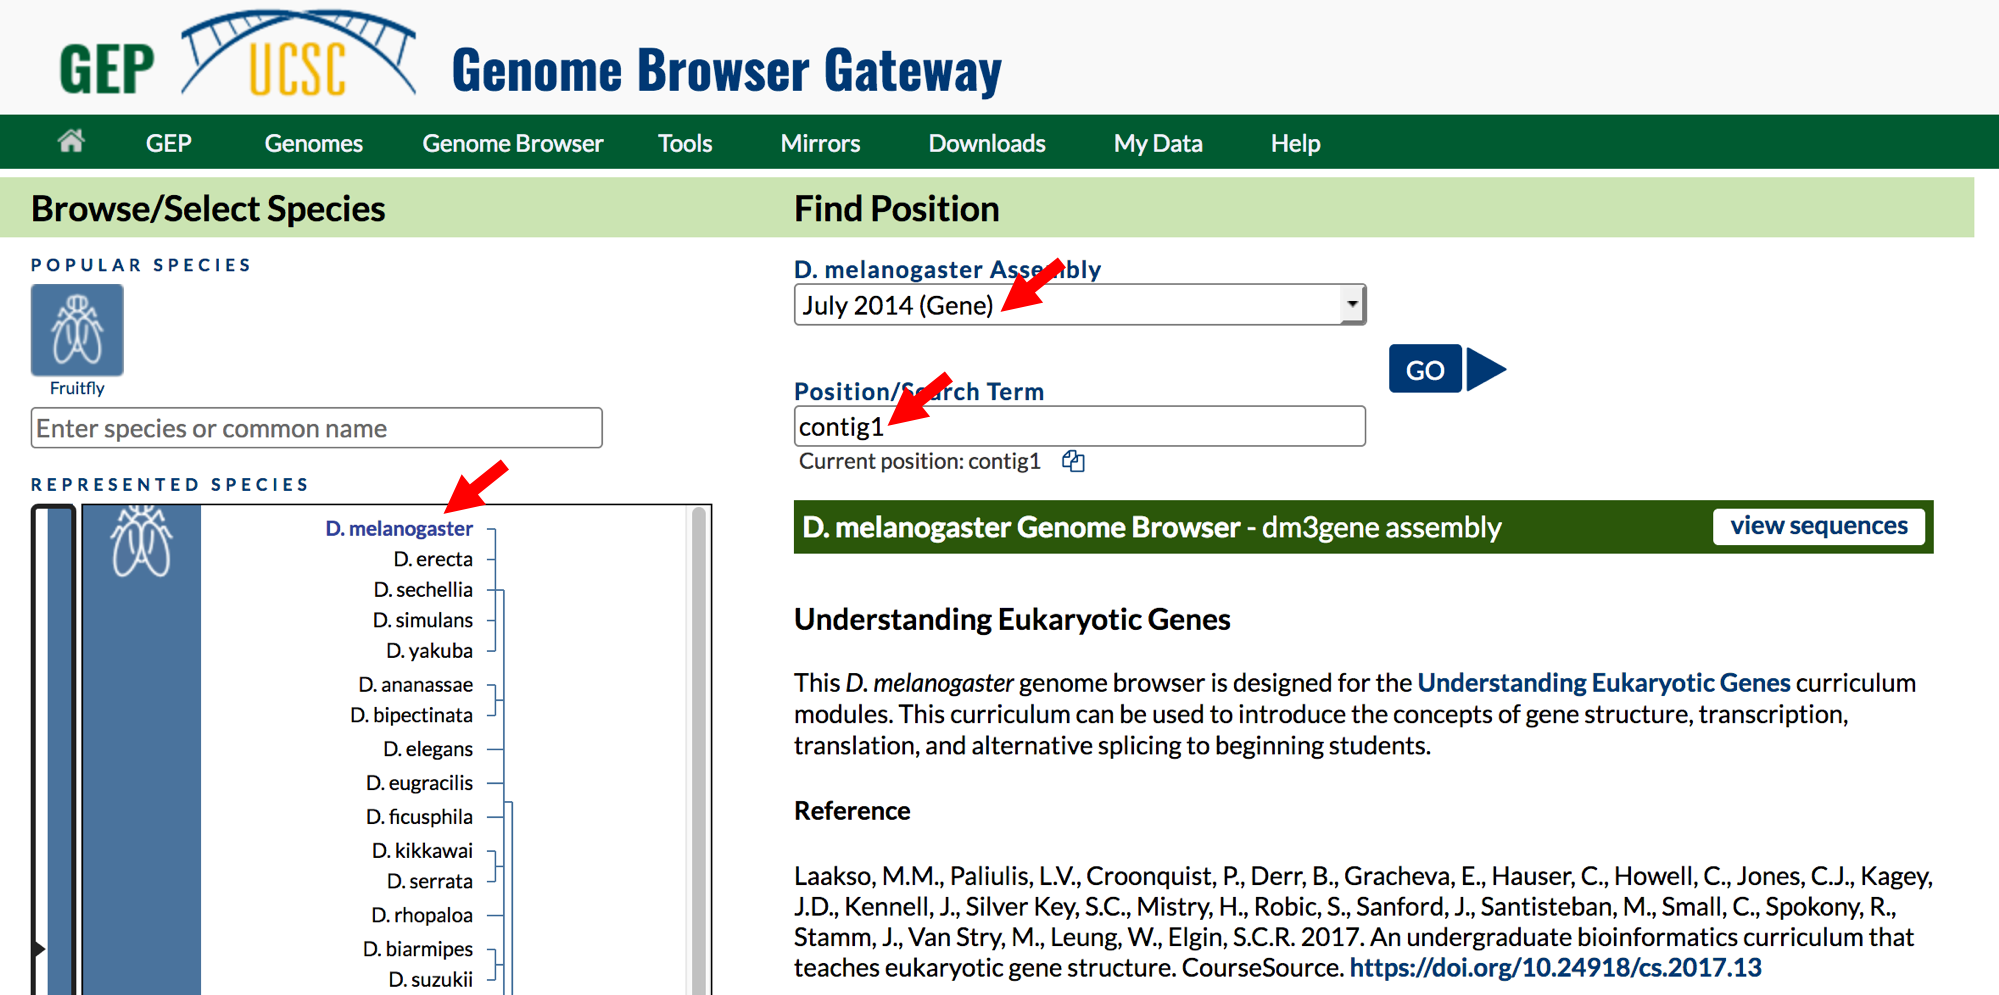
Figure 1.5. Return to the Genome Browser Gateway page and then select the “July 2014 (Gene)” assembly.
The “size” field now has the value “size 11,000 bp”, which means that contig1 has a total length of 11,000 bp.
To further explore the features on contig1, we will examine the results from two of the available tracks.
- Scroll down to the “Display controls” section (i.e. green bars) to
the bar labeled “Mapping and Sequencing Tracks” and verify that the
display mode under the “Base Position” track is set to
denseand the “FlyBase Genes” track is set topack. - The display mode for all other evidence tracks should be set to
hide(Figure 1.6). - Click on any
refreshbutton to update the Genome Browser image.
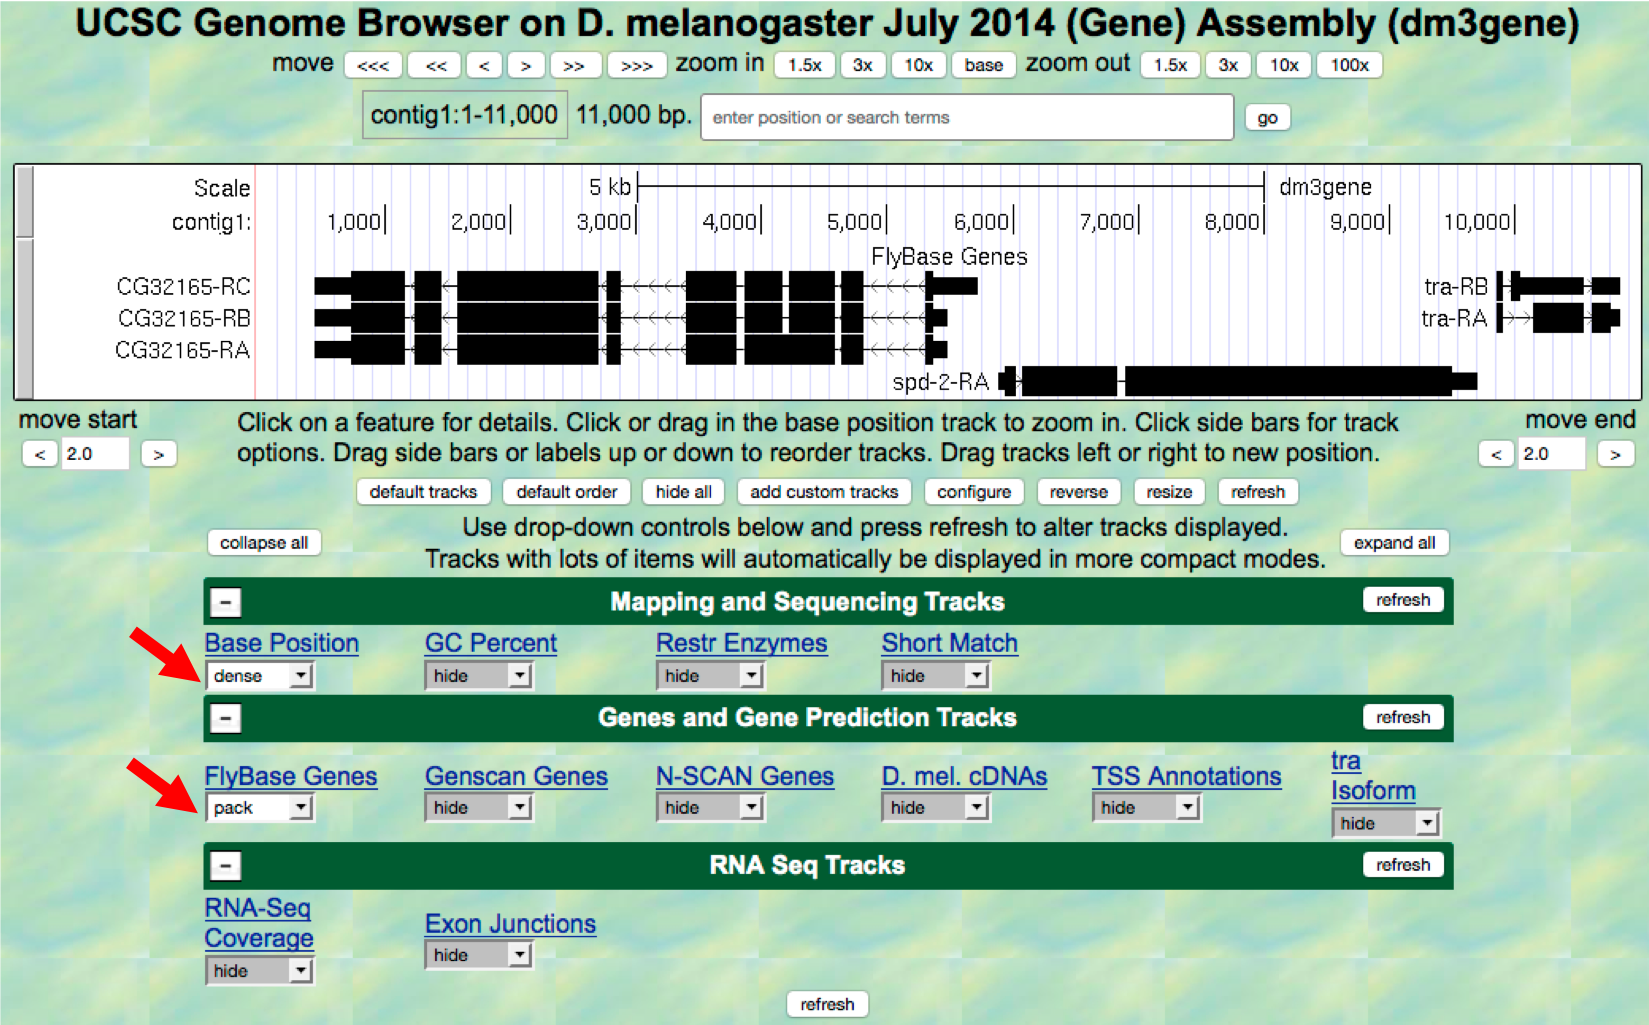
Figure 1.6. Verify the display settings for the “July 2014 (Gene)” assembly.
Explore the contig1 genomic region using these tracks on the Genome Browser. You will observe distinct groups of connected boxes. These connected boxes and lines are genes, and their names are indicated on the left. Connected boxes and lines that are stacked vertically represent alternative forms of a gene, called isoforms. Answer the following questions:
Question 1
How many genes are there in contig1?
Question 2
What are the names of these genes?
Question 3
Which gene has the largest span (i.e. the largest distance between the start and end of the gene)?
- Now let’s examine the gene at the end of this contig more closely.
Type
contig1:9,841-9,870into the “enter position or search terms” text box and then click ongo. (Note that you don’t need to use commas when entering base positions). The Genome Browser image will update to show only bases 9,841 to 9,870 of contig1. Note the letters that appear just below the base position numbers. These letters correspond to the nucleotide at each position. For example, both forms of the tra gene, tra-RA and tra-RB, begin with a T at position 9,851 (Figure 1.7).
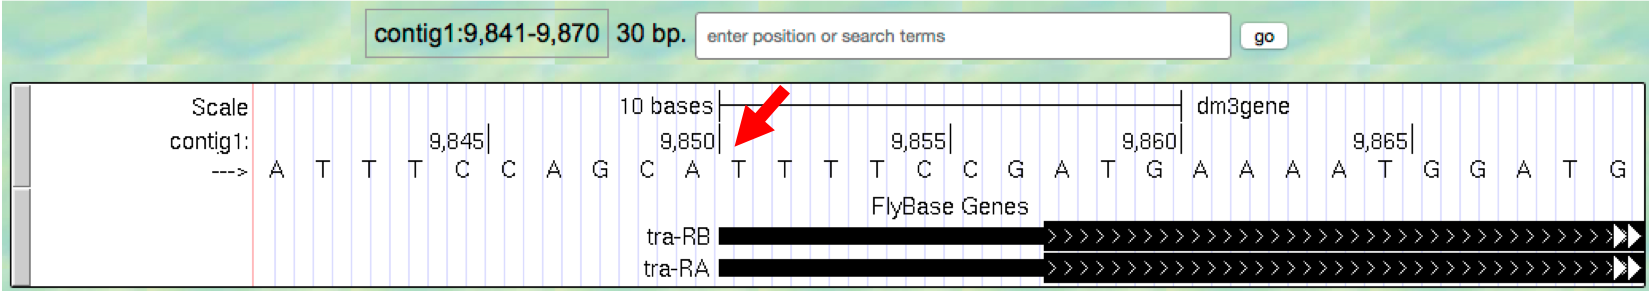
Figure 1.7. The Base Position track shows the underlying genomic sequence for a region when you zoom in.
- Look at the left end of the display, under the word “contig1”. The
arrow here is pointing to the right. When you click on the
--->arrow, the arrow will switch orientation and point to the left (Figure 1.8, top). In addition, the nucleotides in the “Base Position” track will also change from black to grey. Clicking on the<---arrow again will return it to its original orientation (Figure 1.8, bottom).
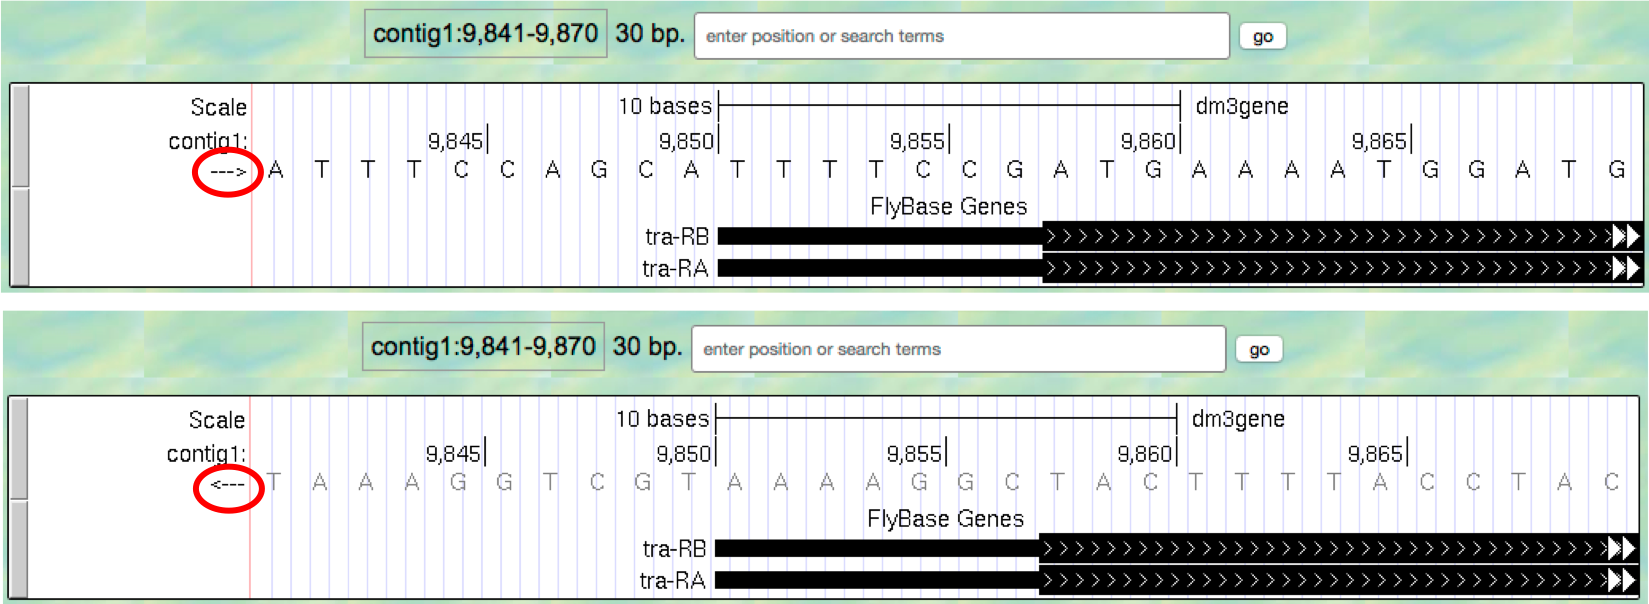
Figure 1.8. Click on the arrow to change the nucleotides shown on the base position track.
Question 4
What is the relationship between the bases displayed when the arrow is pointed to the left versus when it is pointed to the right?
Question 5
Why do you think the bases are displayed in this way in the Genome Browser?
Both forms of the tra gene begin at 9,851 and they have the same prefix (“tra”) but different suffixes (“-RB” and “-RA”, respectively). The prefix corresponds to the name of the gene (tra) in D. melanogaster while the two suffixes indicate that there are two different versions (i.e. isoforms) of this gene. We will examine the differences between these two isoforms later. For now, we will focus our analysis on the A isoform of tra (tra-RA).
1.2. Genes are composed of exons and introns
Learning Objectives
- Determine the orientation, number of exons, and number of introns for any given isoform.
- To see the entire tra gene, type
contig1:9,800-10,860in the “enter position or search terms” text box and clickgo(Figure 1.9). Alternatively, you can use the buttons next to the “zoom out” label and the arrows next to the “move” label to adjust the display.
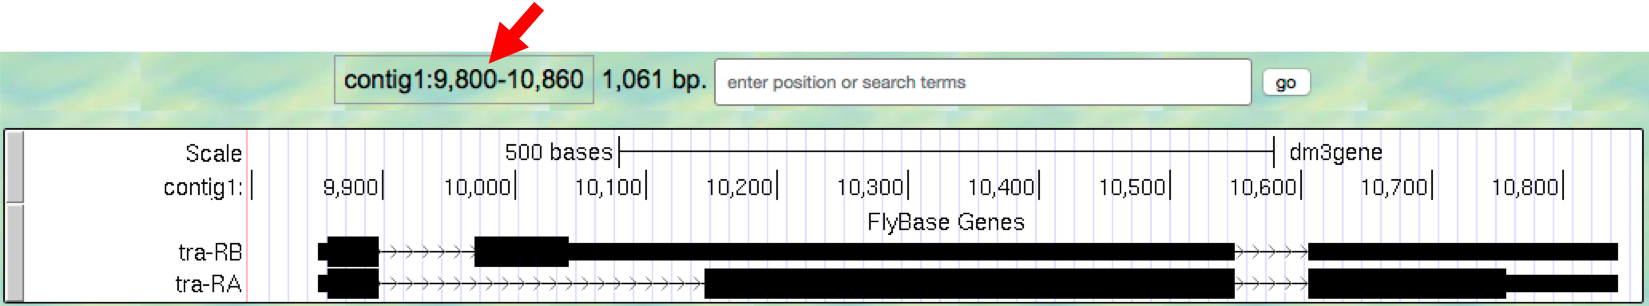
Figure 1.9. The genomic region surrounding the tra gene.
- Carefully examine the tra-RA isoform. Notice that the isoform consists of black blocks that are connected by lines. On the lines are arrowheads that point from left to right. The black blocks are the exons (expressed regions of the gene; Figure 1.10). To use the information stored in a gene, a cell uses the DNA sequence as a template to produce a molecule called a messenger RNA (mRNA). This process is called transcription. You will see in Module 2 that while the initial transcript (product of transcription) is continuous, copying all the DNA, only exon sequences are retained in the processed mRNAs. The lines connecting the blocks are the introns (intervening regions of the gene). These sequences will be removed during the production of mature mRNAs. The arrows on the lines denote the direction of transcription (or orientation) of the gene.
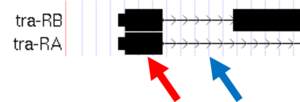
Figure 1.10. The black boxes (indicated by the red arrow) are the exons and the lines connecting the blocks (indicated by the blue arrow) are the introns.
Question 6
How many exons does tra-RA contain?
Question 7
How many introns does tra-RA contain?
1.3. Genes provide the information to make proteins
Learning Objectives
- Use the genome browser to visualize the three possible reading frames on each strand.
- Locate the start codon and stop codon for any given isoform.
The mRNA sequence contains the information that the cell needs to make proteins. You will learn more about this process in Module 5. Here we will use the Genome Browser to examine the basic features of a protein.
- Return to the Genome Browser, and type
contig1:9,850-9,875into the “enter position or search terms” text box. - Scroll down to the “Mapping and Sequencing Tracks” section and
change the display mode for the
Base Positiontrack tofull(Figure 1.11). - Click on the
refreshbutton to update your display.
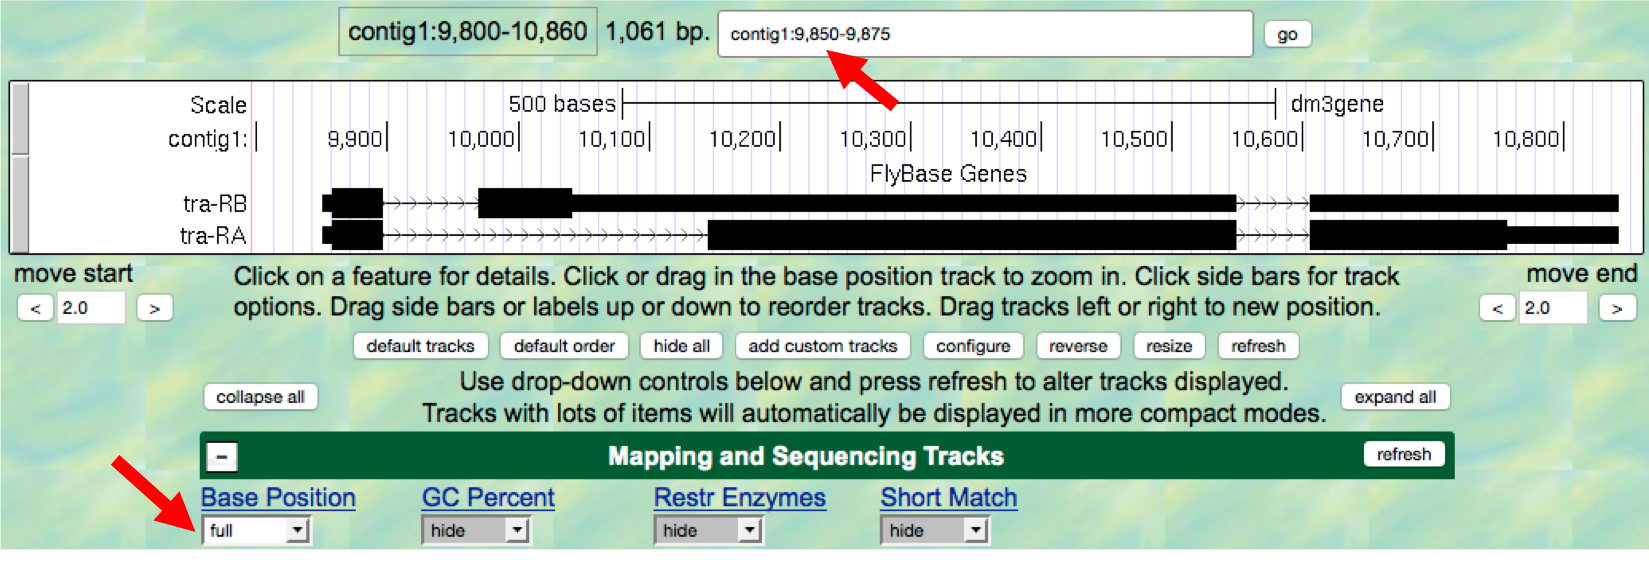
Figure 1.11. Examine the “Base Position” track in the “full” display mode.
Proteins are made up of amino acids, and the mRNA provides the information for the amino acid sequence. This information is read by the cell in groups of three bases, with each three-base group (i.e. codon) specifying an amino acid. The Genome Browser uses single-letter abbreviations to represent each amino acid. These are shown on your Genome Browser as three new rows of information directly below the DNA sequence (Figure 1.12).
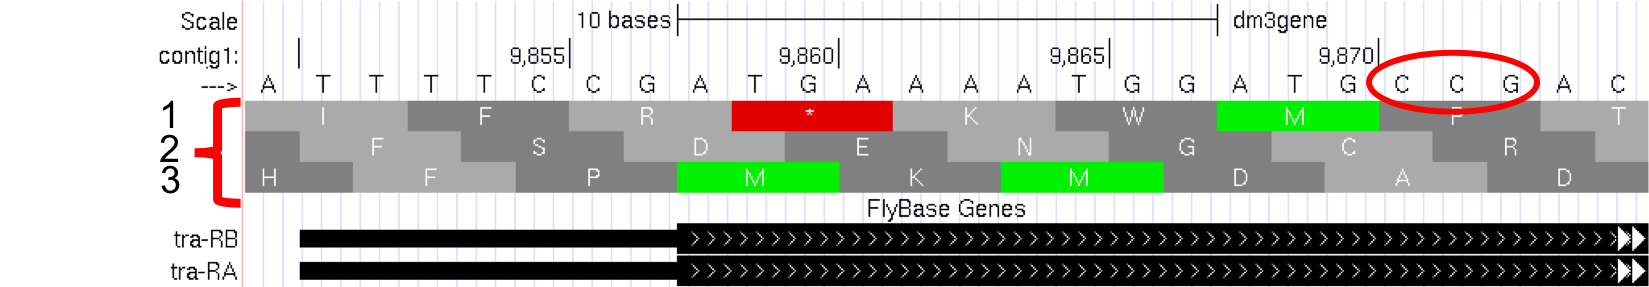
Figure 1.12. Three new rows appear beneath the nucleotide sequence when the Base Position track is in “full” mode.
Question 8
Why do you think it takes three lines to display the amino acid information?
Tip
Remember that a codon is specified by three bases, e.g. CCG = Proline (circled in Figure 1.12).
Module 5 will have more details about translation, the process of copying the information from mRNA into protein. For now, we will just identify the beginning and the end of the protein. You should see three codons that are highlighted in green (one in row 1 and two in row 3). These codons all correspond to the amino acid M (i.e. Methionine). This amino acid is almost always used to start a protein. There is only one codon that can code for Methionine: ATG.
The first M on the third row of amino acids (at 9,858-9,860) corresponds to the start of the protein for the A isoform of tra. The position of this Methionine also coincides with the transition of the thinner rectangle to the thicker rectangle. Hence the thick rectangles denote coding sequence — the parts of the exon that carry information about the protein sequence and are the translated parts — while the thin blocks indicate regions that are part of the exon but do not carry protein sequence information, or the untranslated parts (Figure 1.13).
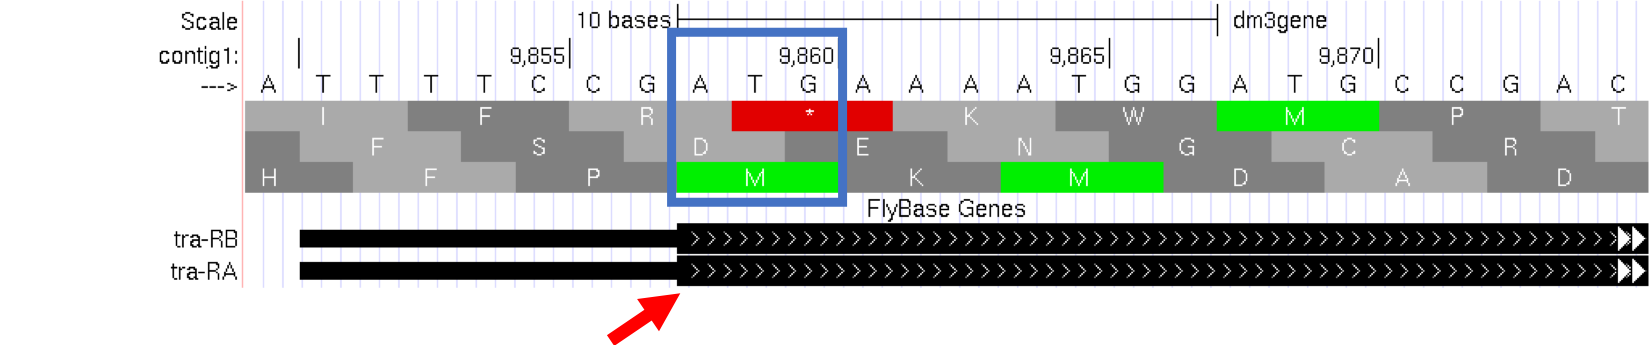
Figure 1.13. The location of the initial Methionine for the A isoform of tra.
Let’s examine the other end of the protein. There are three special codons (known as stop codons) that signal the end of the protein. These codons (TGA, TAA and TAG) are indicated by an asterisk “*” and are highlighted in red in the “Base Position” track.
- Type
contig1:10,740-10,765into the “enter position or search terms” text box and then click on thegobutton. Note the stop codon (*) at position 10,754-10,756, specified by the bases TGA, in the second row of amino acids (Figure 1.14). This is the last codon before the transition from the thick exon block to the thinner one. The Genome Browser therefore shows that a part of the mRNA extends beyond the end of the protein-coding region. This is a general property of mRNAs: they contain extra sequences both before and after the protein-coding sequence. These sequences, at the 5’ and 3’ end of the protein-coding sequences, are called the 5’ and 3’ UTRs (untranslated regions) respectively.
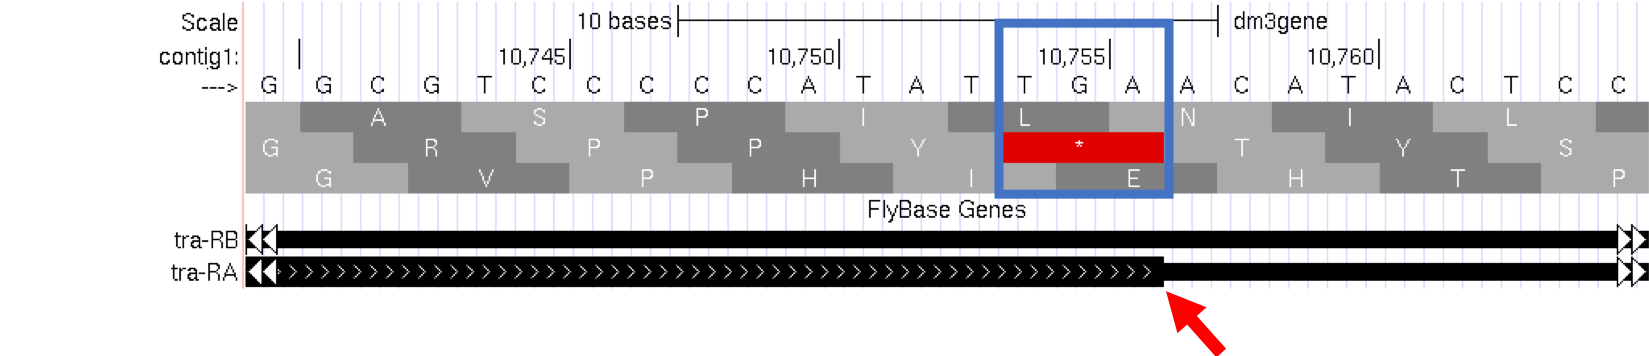
Figure 1.14. The end of the translated region for the A isoform of tra.
1.3.1. Genes have directionality
As you saw above, the sequence of the codons in the A isoform of tra are read from left to right relative to the orientation of contig1. This also means that the start of the protein is located toward the left of the end of the gene. However, recall that DNA is double-stranded, and that the two strands run in opposite directions to each other (i.e. they are antiparallel). It turns out that, like the tra gene here, some genes are read on the DNA strand conventionally termed the “top strand” (from left to right), while other genes are read on the “bottom strand” (from right to left). We will examine one such example next.
- Type
contig1:5,350-5,375into the “enter position or search terms” text box and then click on thegobutton. This region contains the start of the protein-coding region of the CG32165 gene. However, there are no Methionines (green boxes) at the transition point between the thin and thick rectangles (Figure 1.15, top). However, note that the arrows in the thicker part of the indicated exon point from right to left, indicating that this gene is read from the bottom strand. - Click on the
arrowbeneath the “contig1” label in the “Base Position” track so that it points in the same direction as indicated for the gene in this region. This will complement the sequence and allow you to read the bases of the “bottom” strand of DNA. Remember that the codons on this strand must be read from right to left. Now you can see that there is a start codon in this region, the corresponding green M amino acid (at 5,365-5,367) in the third row (Figure 1.15, bottom).
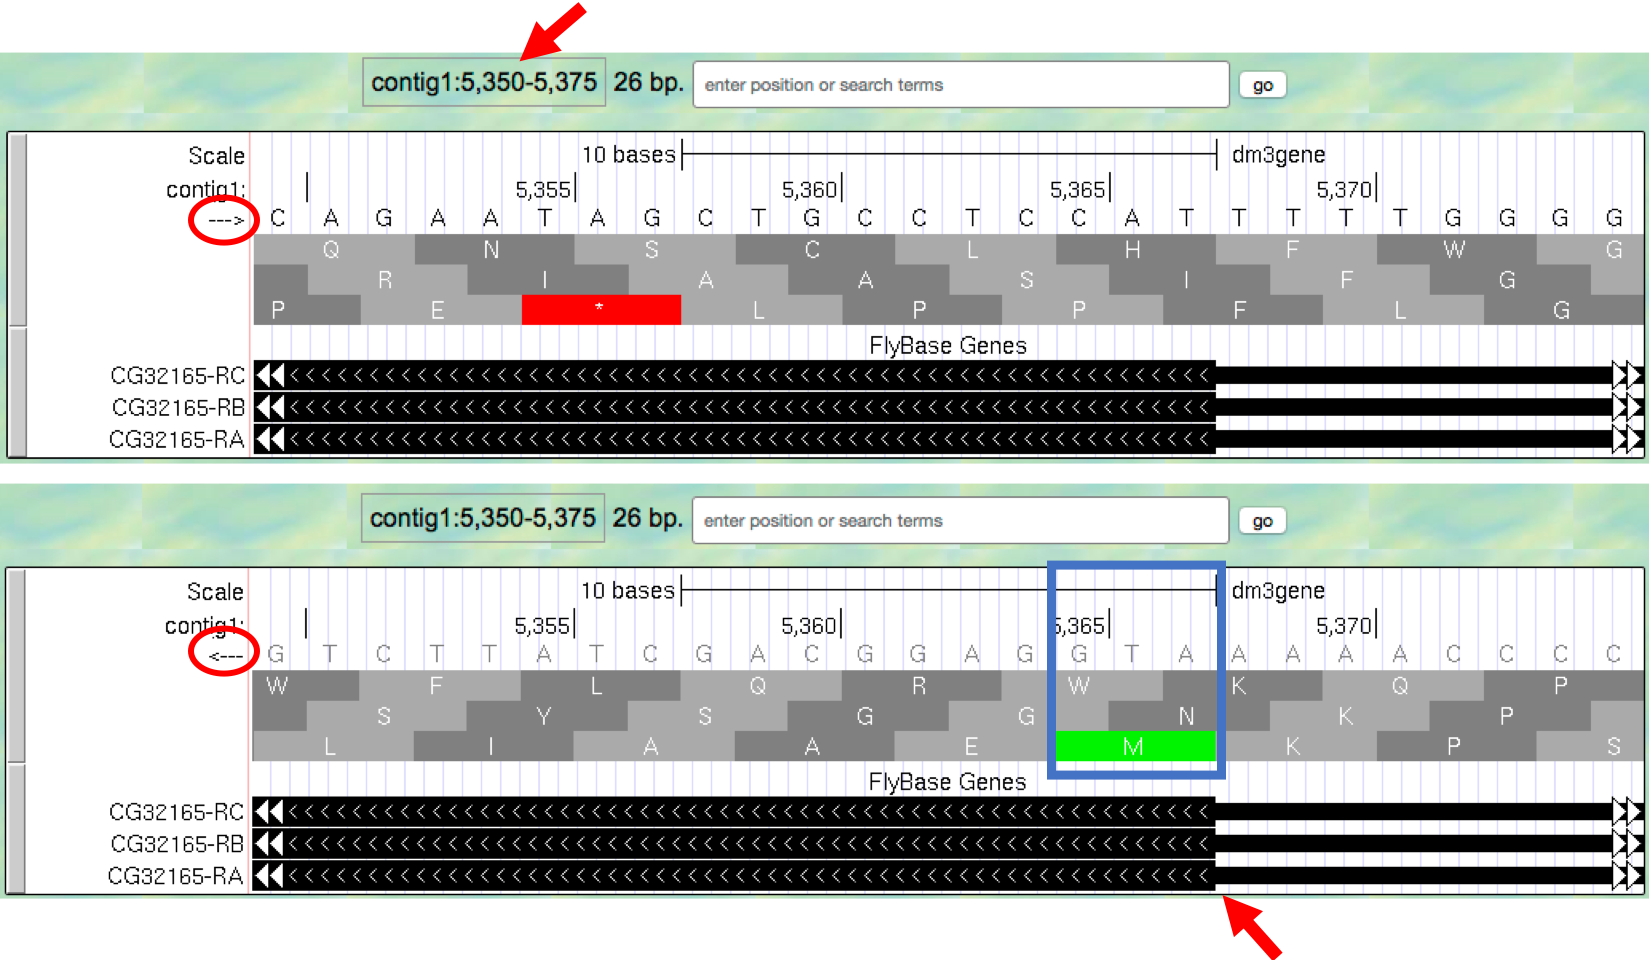
Figure 1.15. Examine the start of the coding region for a gene on the minus strand.
1.4. Coding exons are translated in a single reading frame
Learning Objectives
- Identify open reading frames using the genome browser.
The combination of the directionality (with two alternative directions) and the three rows in the “Base Position” track means that there are six different ways to translate a genomic region, i.e. to determine the sequence of amino acids from a DNA sequence. These different ways to translate a genomic region are known as reading frames.
- To illustrate this concept, change the “enter position or search
terms” text box to
contig1:1-12and then clickgoin order to zoom in to the first 12 nucleotides of the contig1 sequence. - Click on the
arrowunderneath the “contig1” label in the “Base Position” track so that it points to the right (Figure 1.16).
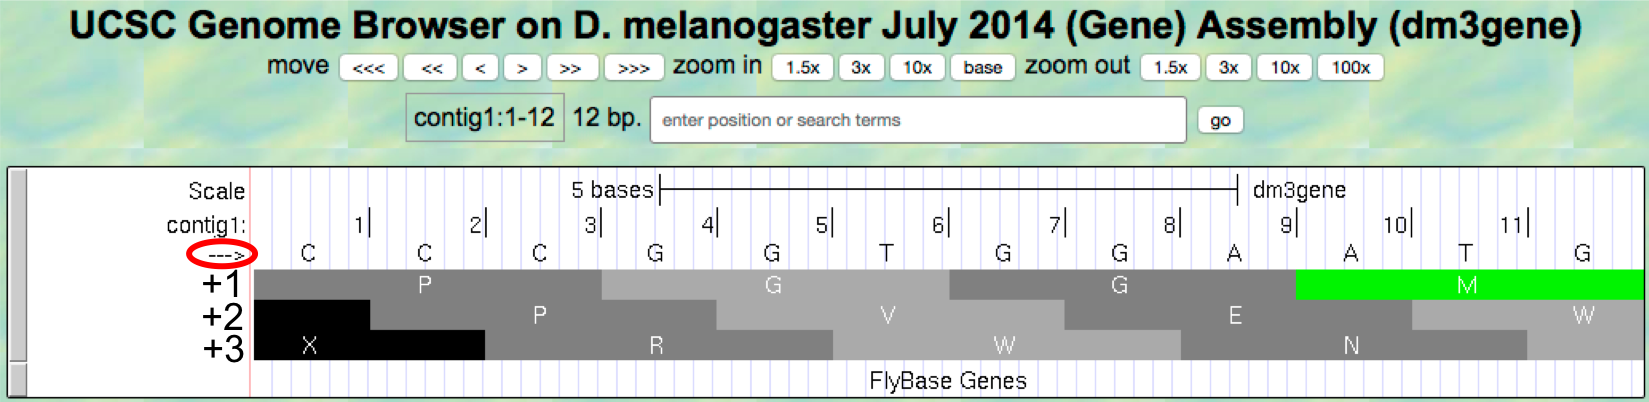
Figure 1.16. Examine the “Base Position” track for the first 12 bases of contig1 in the top strand.
The first row (frame +1) begins at the first nucleotide in contig1 and the first amino acid (P) is derived from the codon CCC. The second row (frame +2) begins at the second nucleotide in contig1 and the codon CCG also codes for the amino acid P. The third row (frame +3) begins at the third nucleotide in contig1 and the codon CGG corresponds to the amino acid R (Figure 1.17). Because a codon is comprised of 3 nucleotides, the codon beginning at the fourth nucleotide (GGT) is again in frame +1.
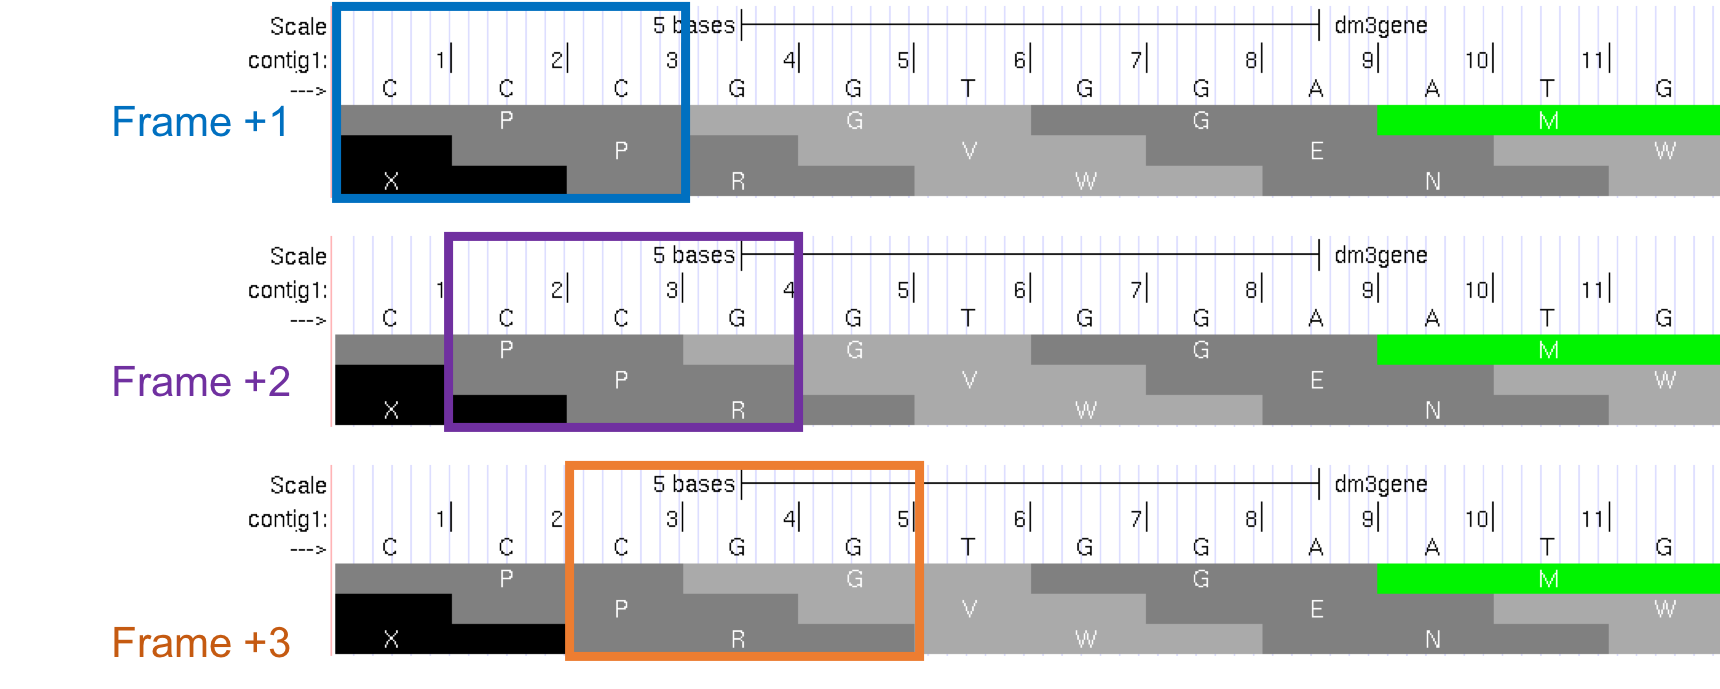
Figure 1.17. Interpreting the reading frame using the Base Position track.
Examination of the “Base Position” track at the beginning of the contig
shows that the three positive reading frames are numbered relative to
the start of the contig1 sequence. Similarly, the three reading frames
on the bottom strand are numbered relative to the end of the contig1
sequence (i.e. the beginning of the reverse complement of the contig
sequence). Because contig1 has a total length of 11,000bp, we will
change the “enter position or search terms” field to
contig1:10,989-11,000 so that we can examine the last 12
nucleotides of this contig.
- Click on the
arrowunderneath the “contig1” label so that it points to the left (Figure 1.18).
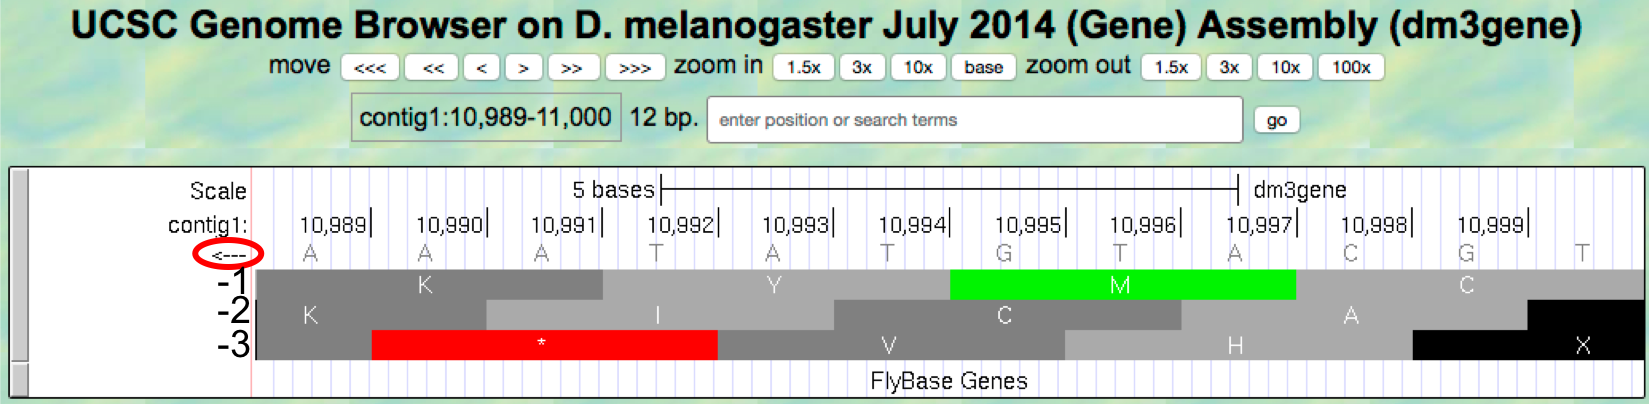
Figure 1.18. Examine the “Base Position” track for the last 12 nucleotides of contig1 in the bottom strand.
Because we are examining the reverse complement of the contig1 sequence, we need to read the nucleotide and amino acid sequences on the “Base Position” track from right to left. The first row (frame -1) begins at the last nucleotide (11,000) of contig1 and the codon TGC codes for the amino acid C. The second row (frame -2) begins at the penultimate nucleotide at 10,999 and the codon GCA codes for the amino acid A. The third row (frame -3) begins at 10,998 and the codon CAT corresponds to the amino acid H (Figure 1.19).
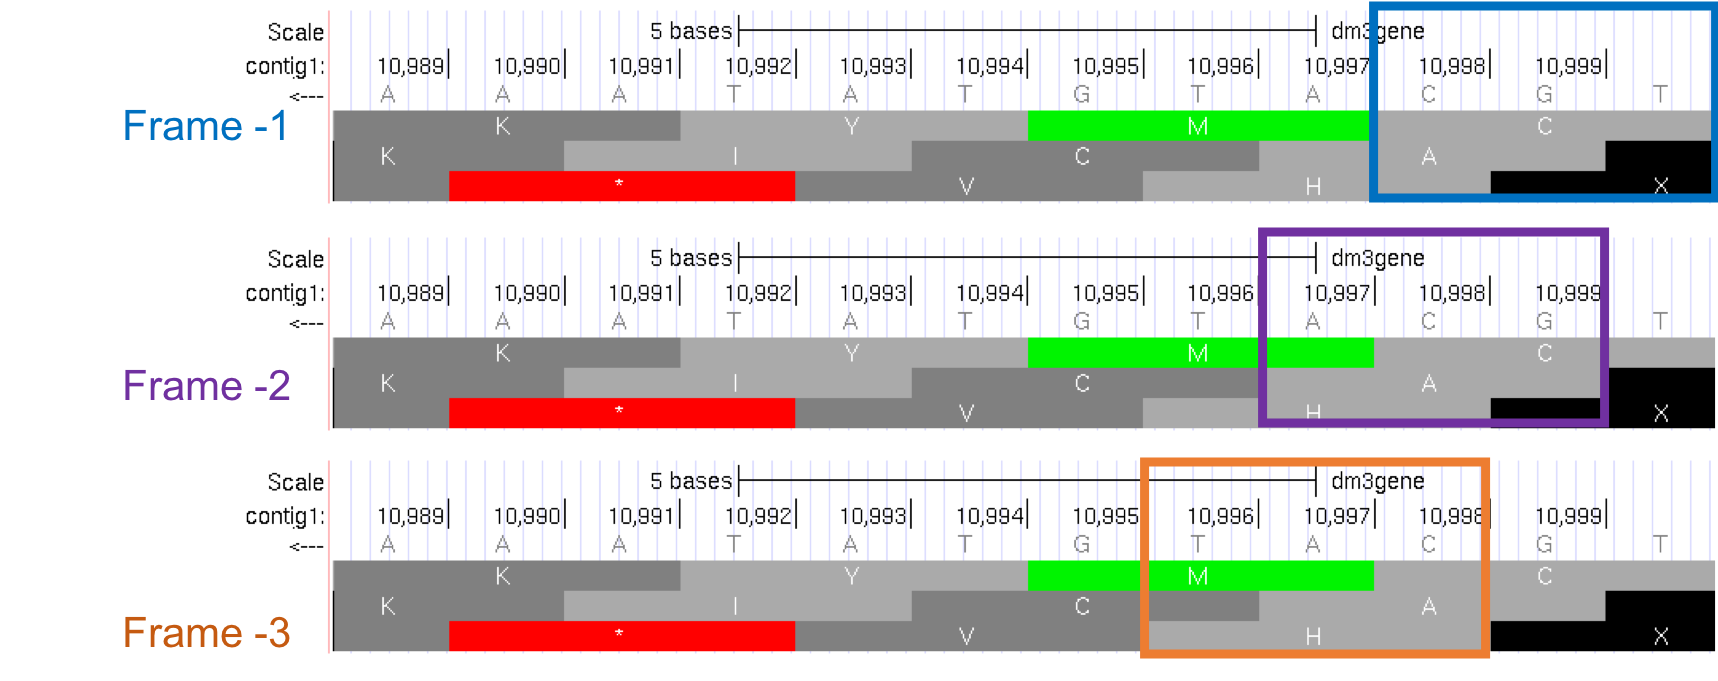
Figure 1.19. Using the “Base Position” track to interpret the reading frames on the bottom strand.
- Now that we understand how to interpret the reading frame
information using the “Base Position” track, we can investigate the
coding regions of the tra gene more closely. Change the “enter
position or search terms” field to
contig1:9,800-9,960and then click on thegobutton. - Click on the
arrowunderneath the “contig1” label in the “Base Position” track so that we can examine the translations of the top strand (running left to right) (Figure 1.20).
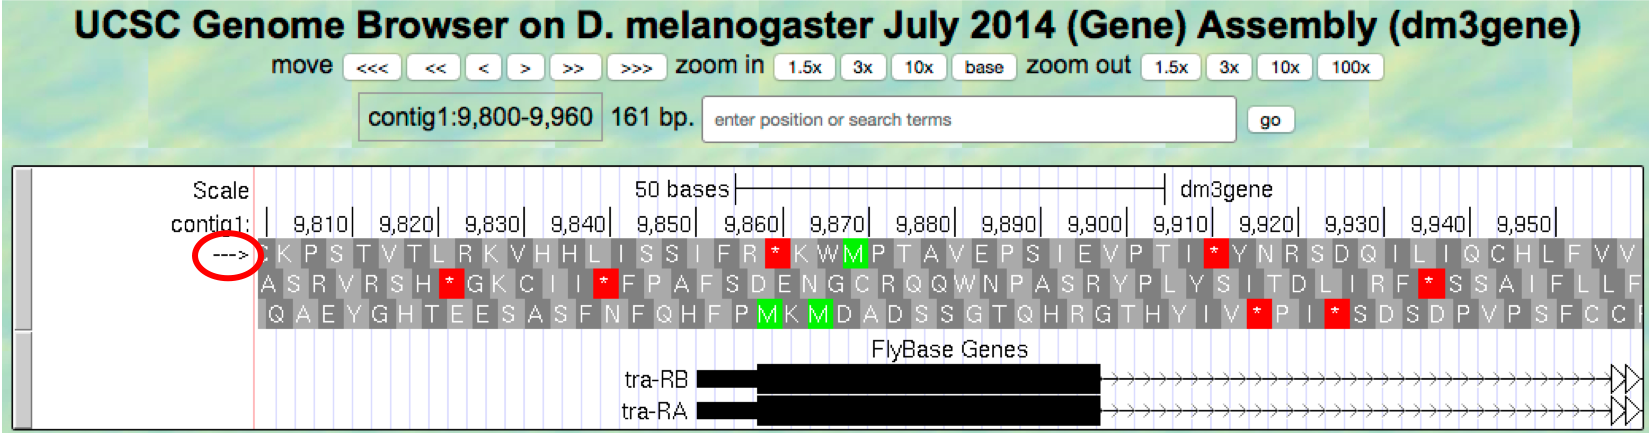
Figure 1.20. The genomic region surrounding the first exon of tra-RA.
Our previous analysis shows that there is a start codon (green rectangle in the “Base Position” track) in the third row that corresponds to the transition from the thin to the thick rectangles (Figure 1.13). Hence the coding part of the first exon of the A isoform of tra is said to be “in frame +3”. Notice that there is also an open reading frame (ORF — stretch of codons uninterrupted by stop codons) that overlaps with the thick box in the second row (frame +2) but there are no start codons that overlap with the thick box. In contrast, the first row (frame +1) contains a start codon, but the thick box also overlaps with a stop codon (red star). When we examine the region downstream of the black boxes, we find that there are stop codons in all three reading frames. However, these stop codons do not interrupt the open reading frame of the first exon because they occur in the region of the arrowed lines (i.e. the first intron, see blue arrows in Figure 1.21).
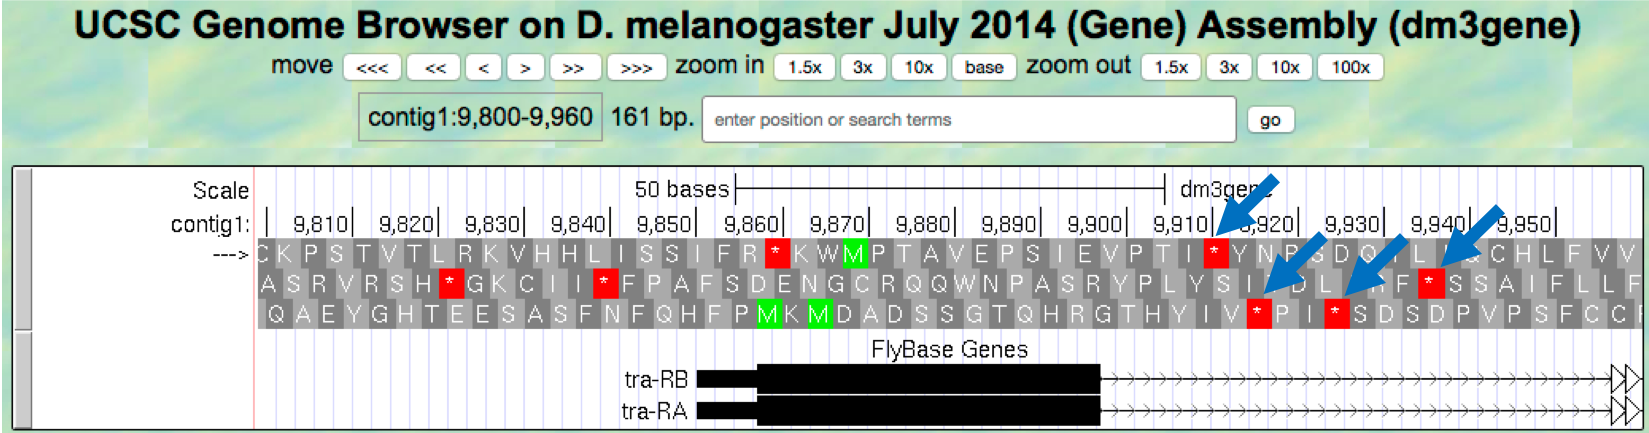
Figure 1.21. Stop codons (red stars) are found in all three reading frames in the first intron of tra-RA.
- Change the “enter position or search terms” field to
contig1:10,100-10,600so that we can examine the second coding exon of the A isoform of tra to determine its reading frame.
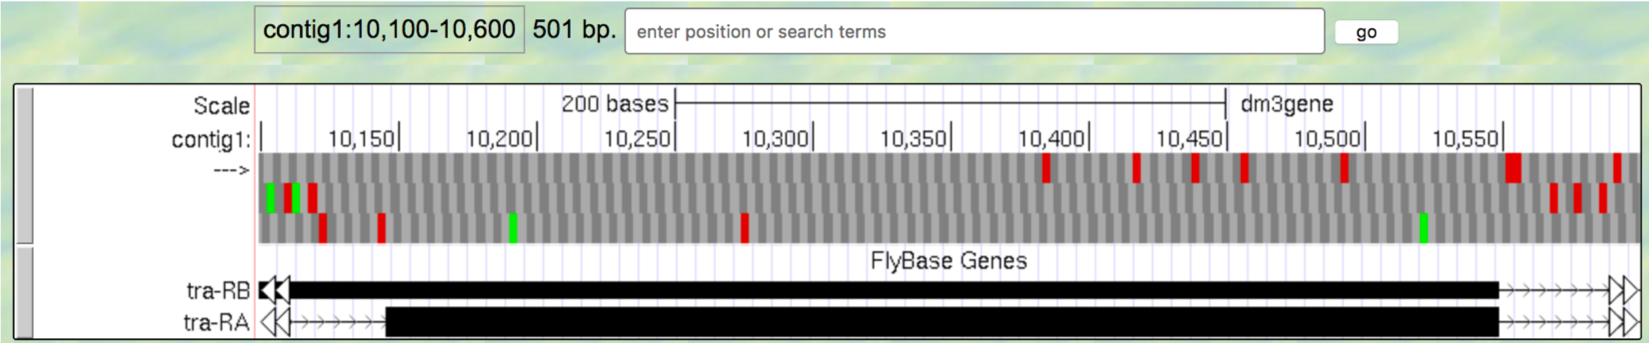
Figure 1.22. The genomic region surrounding the second coding exon of tra-RA.
Question 9
Based on the screenshot shown in (Figure 1.22), which reading frame contains the amino acid sequence for the second coding exon of tra-RA?
- Change the “enter position or search terms” field to
contig1:10,550-10,900so that we can examine the region surrounding the last coding exon of the tra-RA isoform (Figure 1.23). Based on our previous analysis, we know that there is a stop codon in the second row that corresponds to the transition from the translated (thick rectangle) to the untranslated (thinner rectangle) region of the mRNA (Figure 1.15). Hence the last coding exon of tra-RA is in frame +2 (Figure 1.23).
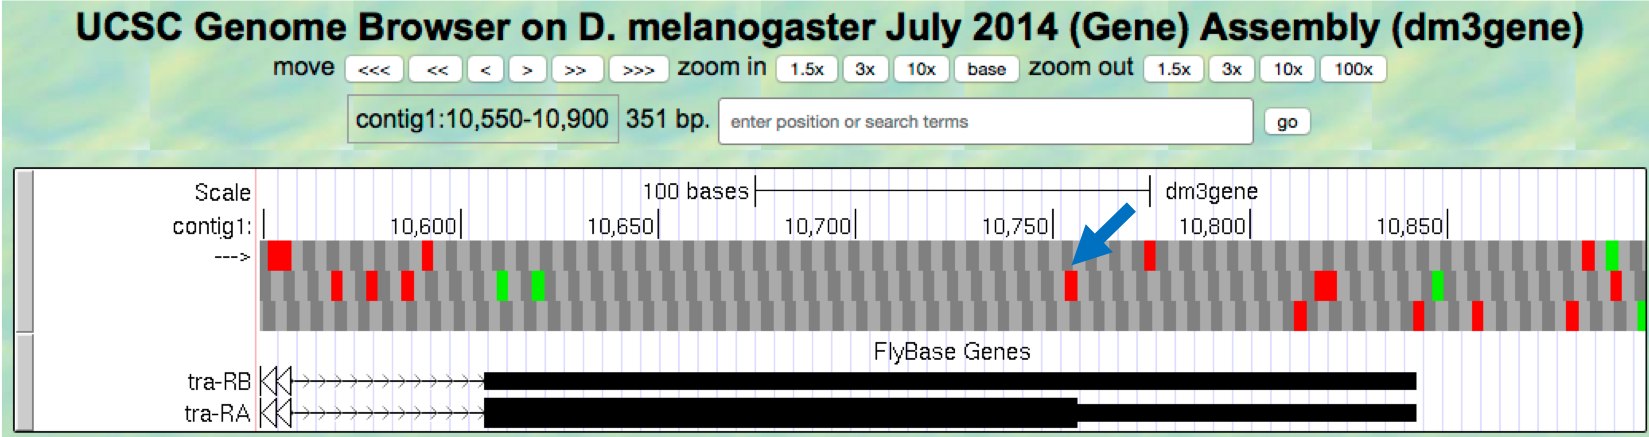
Figure 1.23. The terminal coding exon of tra-RA is in frame +2.
Question 10
Does frame +2 have an ORF in the coding region of this exon? What about frame +1 and frame +3?
Question 11
Given that 3 of the 64 possible codons are stop codons, what is the chance of having a stop codon at any given position, assuming that the sequence is random?
Note
You might have noticed that the initial coding exon of tra-RA is in frame +3 while the last coding exon is in frame +2. We will learn more about mRNA processing in subsequent modules that will explain this apparent discrepancy.
1.5. Conclusion
In this lesson, you have learned to use the basic navigation features of the Genome Browser to examine the basic structure of a eukaryotic gene. To summarize:
- Genes provide the information to make proteins. This information is captured by transcribing the DNA to make RNA, and is carried on the mRNA in the form of three-base groups called codons.
- Genes are composed of exons and introns. Exons are regions retained in the processed mRNA, and are represented by black blocks in the browser, while introns are the regions that are removed during the process of creating the final mRNA, and are represented by lines connecting the blocks.
- The codon ATG in DNA (AUG in mRNA) specifies the amino acid M (Methionine) and is highlighted in green on the “Base Position” track of the Genome Browser. The first Methionine provides the starting signal for protein synthesis.
- The codons TAA, TAG, and TGA in DNA (UAA, UAG, and UGA in mRNA) encode the stop codon (*) and are highlighted in red on the “Base Position” track of the Genome Browser. The stop codons provide the ending signal for protein synthesis.
- Genes may be read either from left to right (top strand of the DNA), or from right to left (bottom strand of the DNA). Arrows on a gene indicate its directionality.
- Each row in the “Base Position” track (set on
full) corresponds to a different reading frame. Different coding exons for a transcript can be in different reading frames.
- To practice using the browser and reinforce the above concepts, examine the third gene in this contig (spd-2-RA):
Summary Question 1
How many exons and introns are present in this gene?
Summary Question 2
What is the orientation of this gene relative to contig1? How do you know? Where are the start codon and the stop codon — give the base position numbers (coordinates) of the start and the stop codon?
You have now completed Module 1, and are ready to move on to Module 2.
1.6. Bonus question
Take a little time to explore some of the other evidence tracks on the browser.
Bonus Question 1
While looking at contig1 (size 11,000 bp), put the “GC Percent”
track on full. What sort of pattern do you see, relative to the
map of the genes? What can you conclude about gene structure?